
Workforce-Banner

Narrative Reporting 

Board Reports. Your Numbers and Narrative Together.

Turn live financial data, charts, and commentary into board reports, budget books, and management packages. Explain variances, highlight what matters, and add supporting content in one connected document—so leadership gets the numbers and the context to act.

Limelight-Narrative-Numbers-and-Commentary-Transparent
Connected Narrative Reporting.

The Numbers. The Explanation. The Next Step.

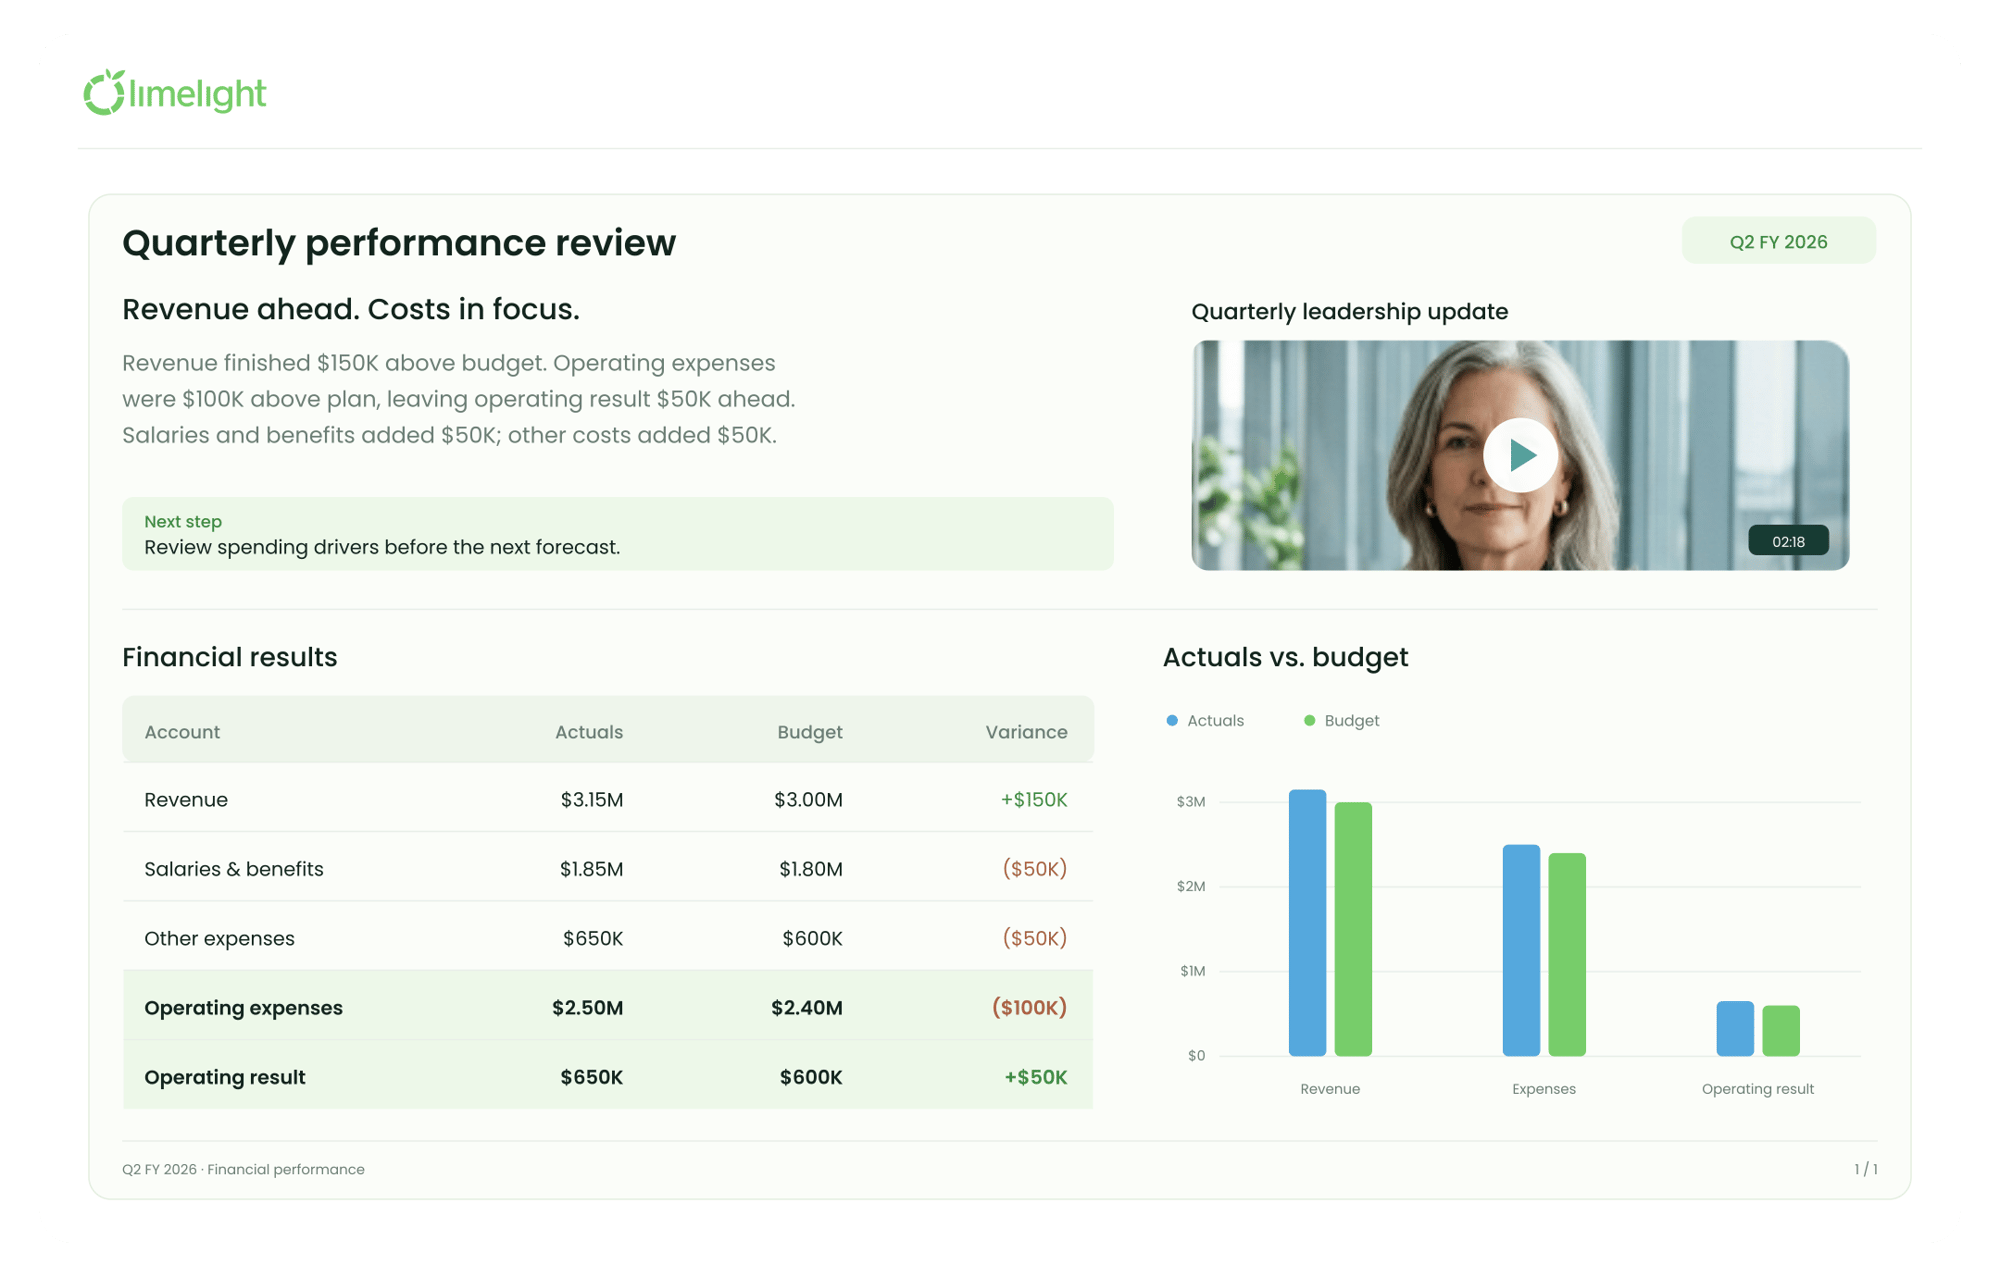
Bring financial results and the context behind them into Limelight Docs. Give leadership a report that explains performance, shows the plan, and makes the next conversation more useful.

greenbar_01

Keep the Numbers Current

Use live financial figures from your Limelight model, so reports reflect changes to actuals, budgets, and forecasts.

greenbar_01

Explain what Changed

Put your variance commentary beside the results. Show what drove performance and what needs attention.

greenbar_01

Bring the Full Context

Combine financial tables, charts, images, video, and supporting documents in one connected report.

Live Numbers & Commentary

Bring actuals, budgets, and forecasts into the same document as your analysis. Explain the drivers behind each variance, flag what needs attention, and show leadership what comes next.


Limelight-Narrative-Numbers-and-Commentary-Transparent

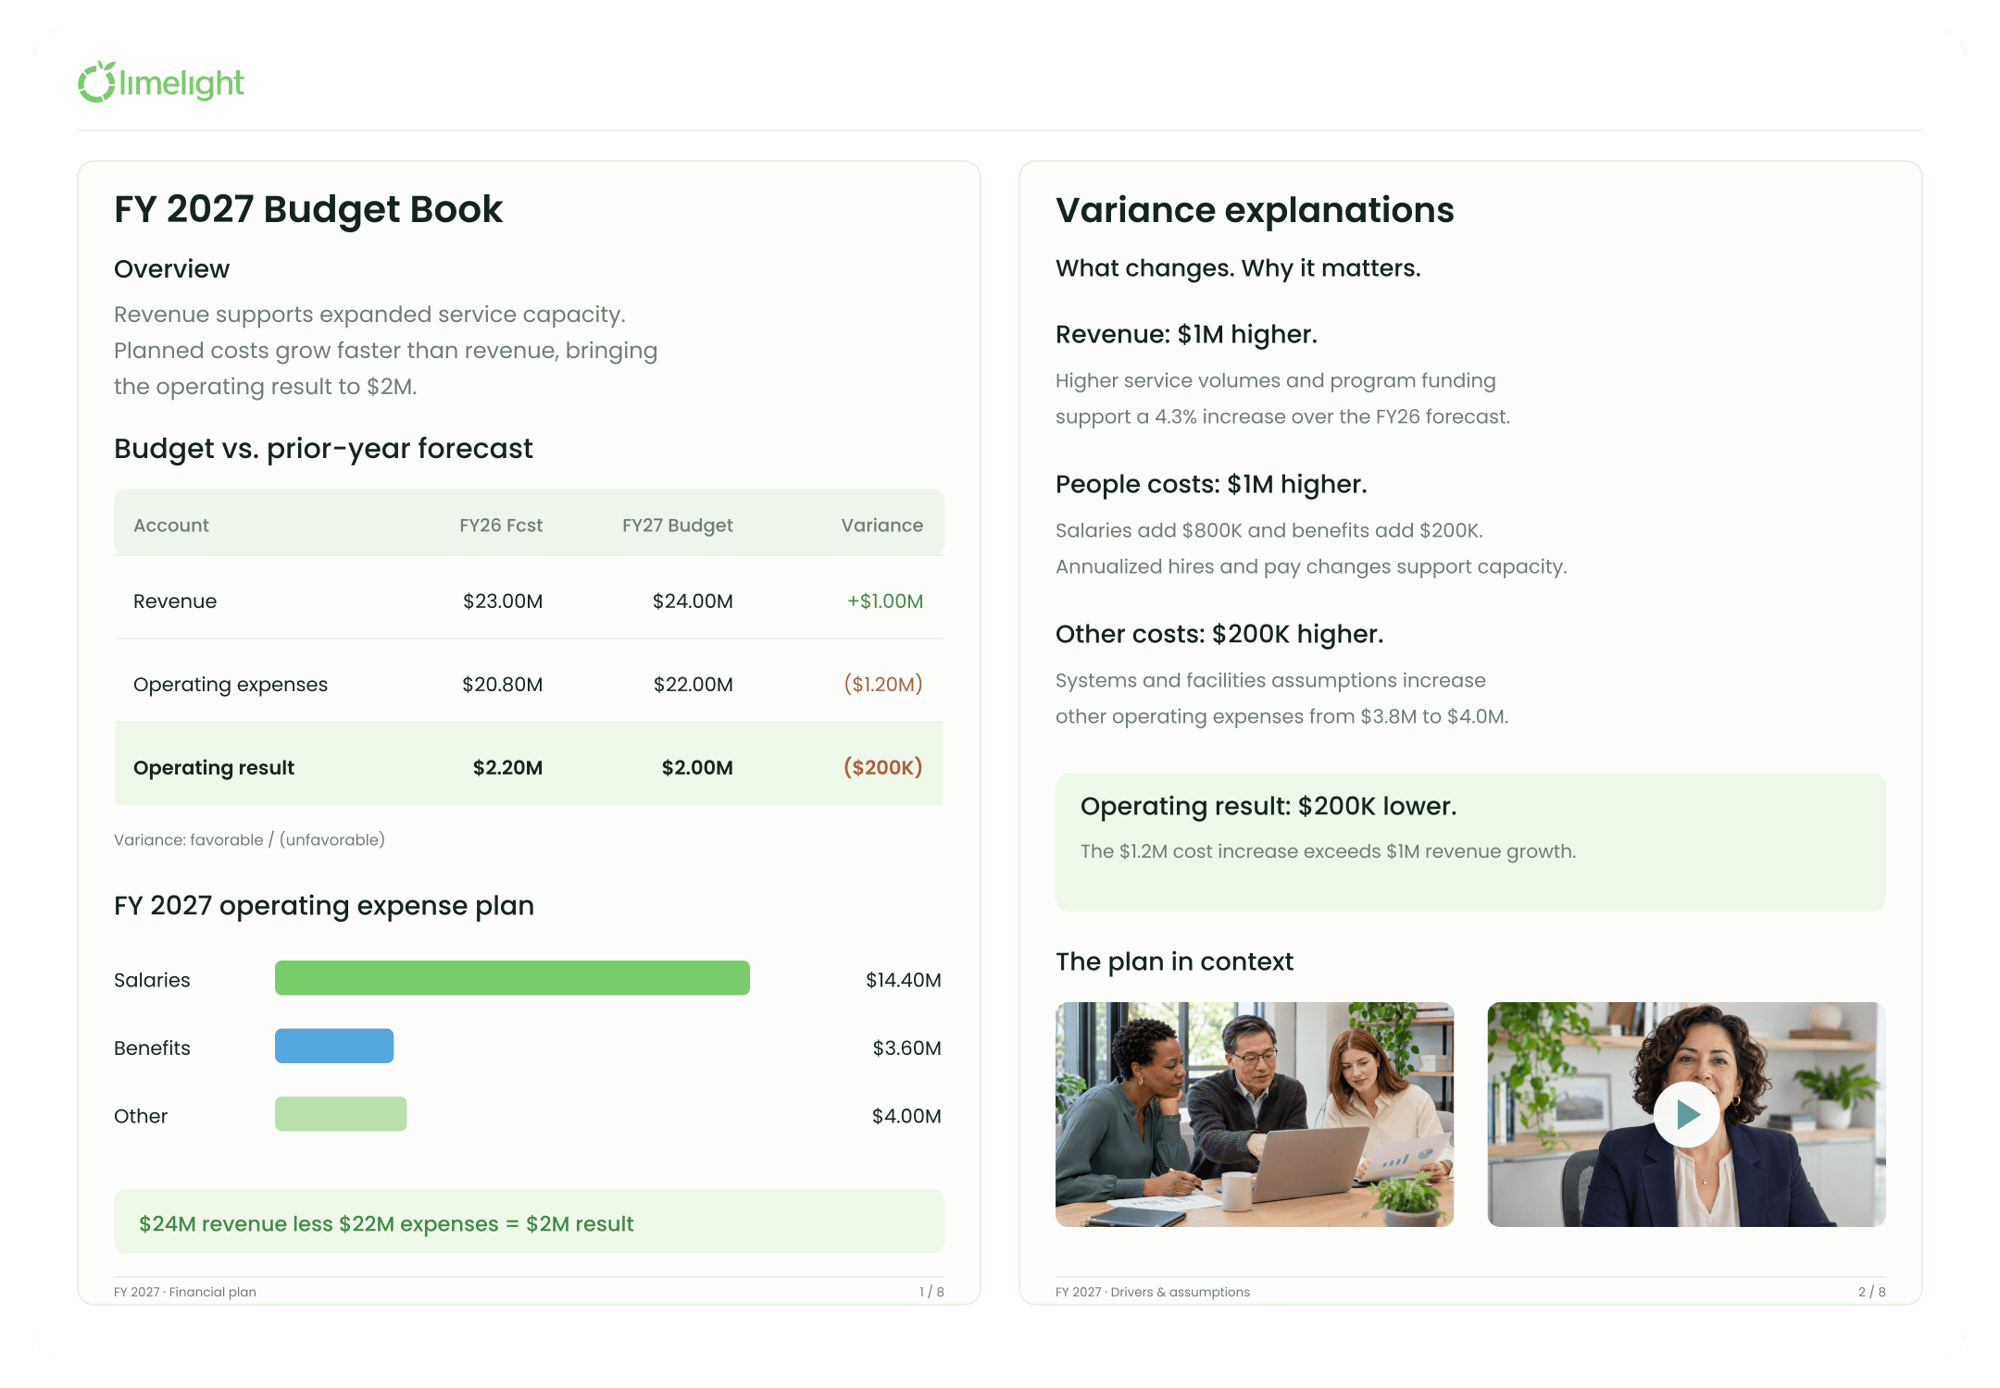
Budget Books & Forecast Packages

Give leadership more than a set of totals. Bring the budget, planning assumptions, department context, and supporting documents together—so readers can see what the plan includes and why.
Limelight-Narrative-Budget-Book-Transparent

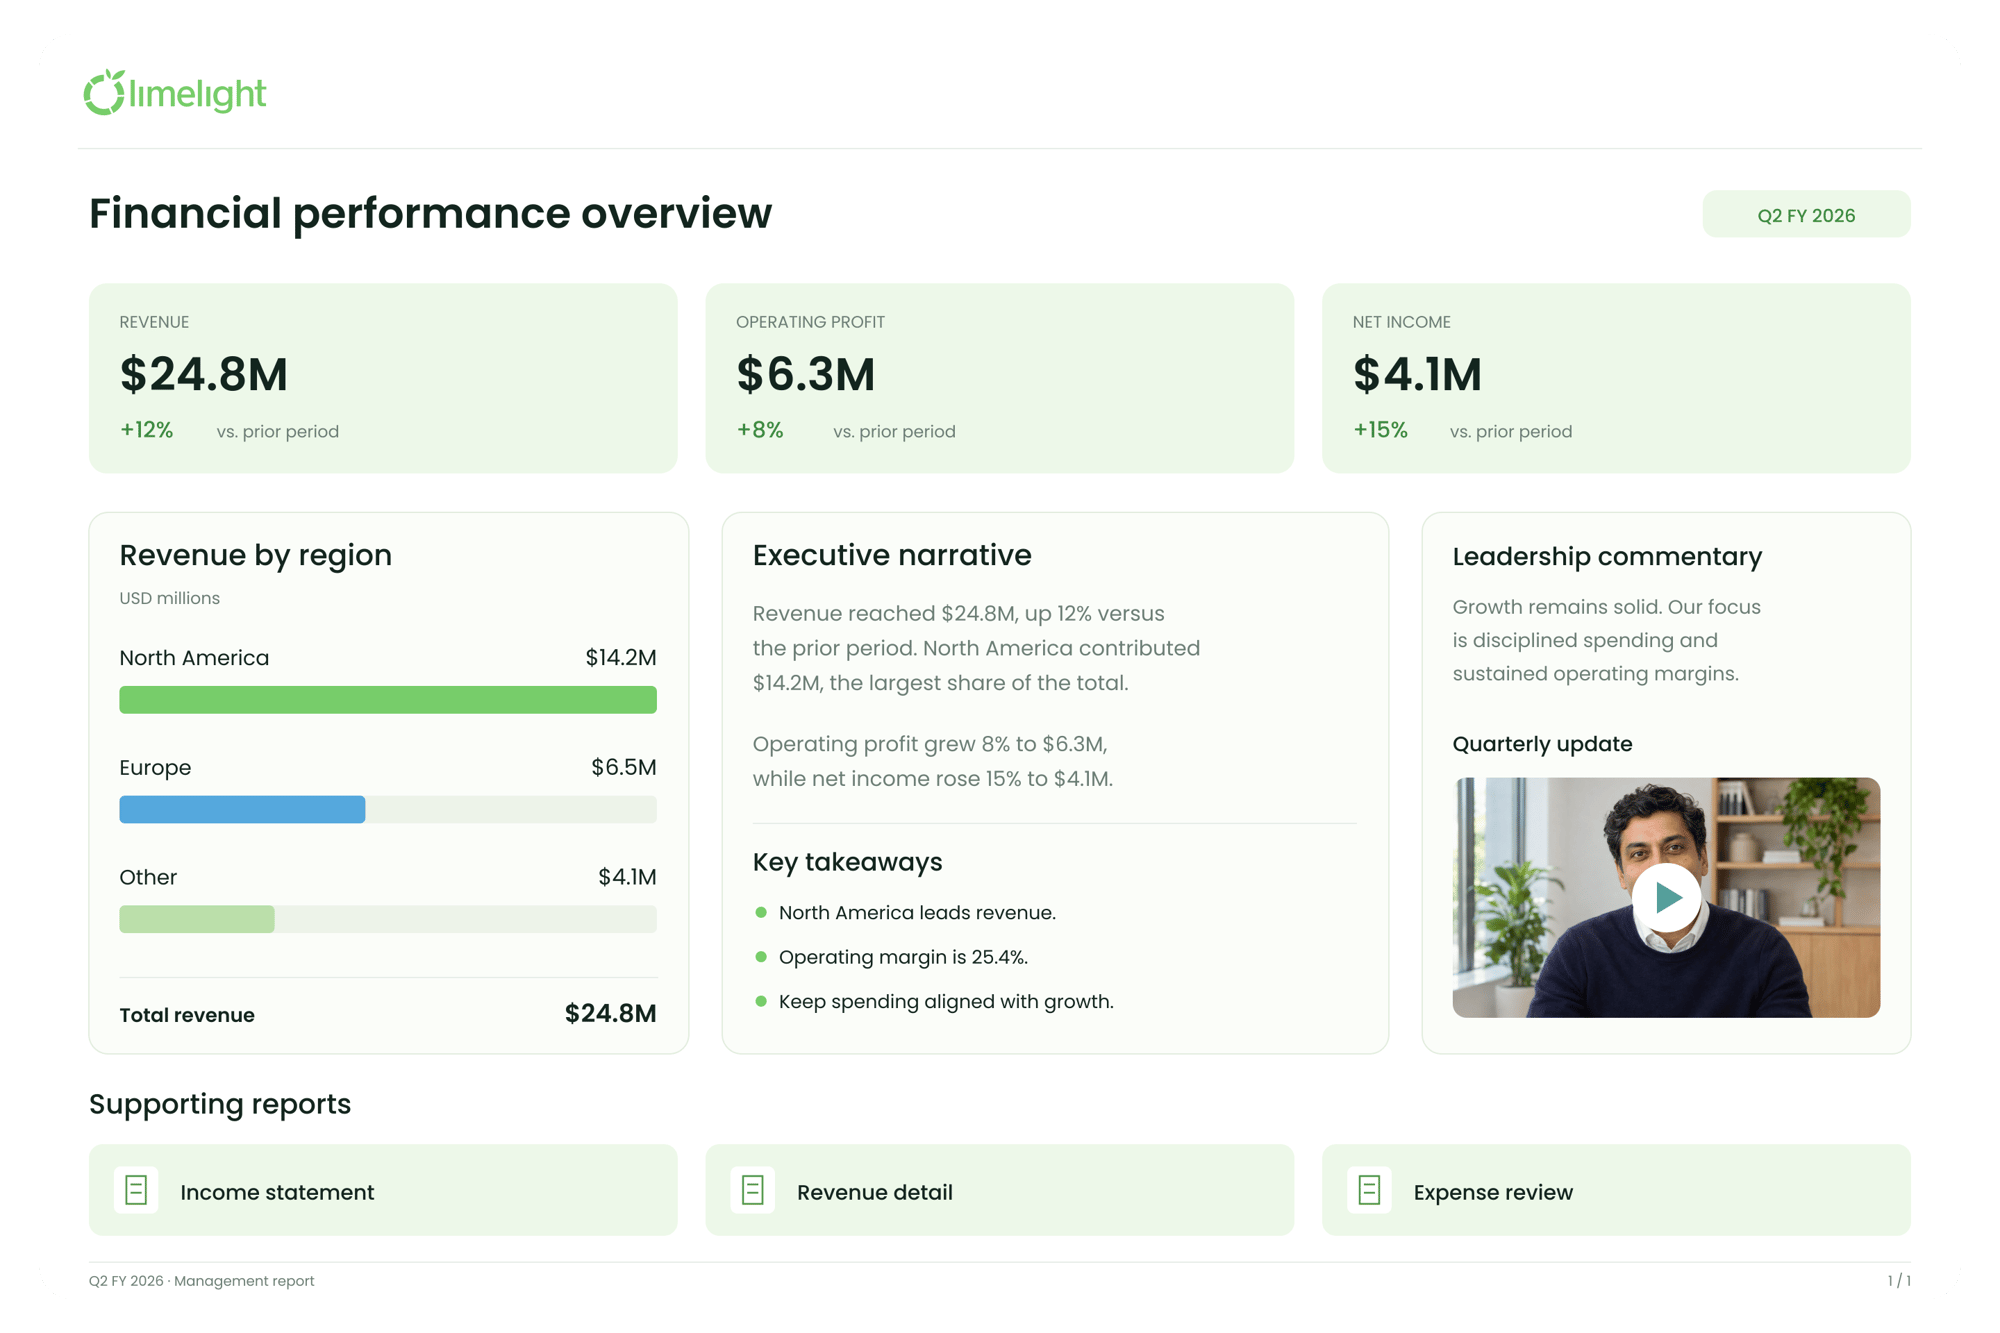
Board & Leadership Reports

Connect the financial results with your leadership update. Add charts to show performance, a video to explain priorities, and supporting details for the questions that follow.
Limelight-Narrative-Financial-Performance-Overview-Transparent

Reports for Every Financial Conversation

Board Reports
Budget Books
Management Packages
Forecast Updates
Grant & Program Reports
Executive & Investor Updates

Frequently Asked Questions about Modern FP&A

What is narrative reporting?

It brings financial results and their explanation together. Your team adds commentary, charts, and supporting content so readers understand what changed, why it matters, and what comes next.

What can we create in Limelight Docs?

Can Limelight Docs include media and visuals?

Do financial figures update in real-time?

Can we include charts, video, and attachments?

How is this different from a financial report?

Can we use it for budget books and forecast packages?

Ready to Build Your Next Board Report in Limelight?

Book a personalized demo. See how live financial data, commentary, charts, and video come together in Limelight Docs.