
%20(1).svg)

Reporting Should Do More than Show Numbers
With Limelight, reporting becomes more than a month-end task. It becomes a real-time way to understand the business.

See the story behind the numbers
Add comments, attachments, and variance explanations beside the numbers so every report includes the context leadership needs.

Spot trends faster
See what’s changing across actuals, budgets, forecasts, and scenarios to act on risks, opportunities, and performance.

Analyze Deeper
Live Financial Reports
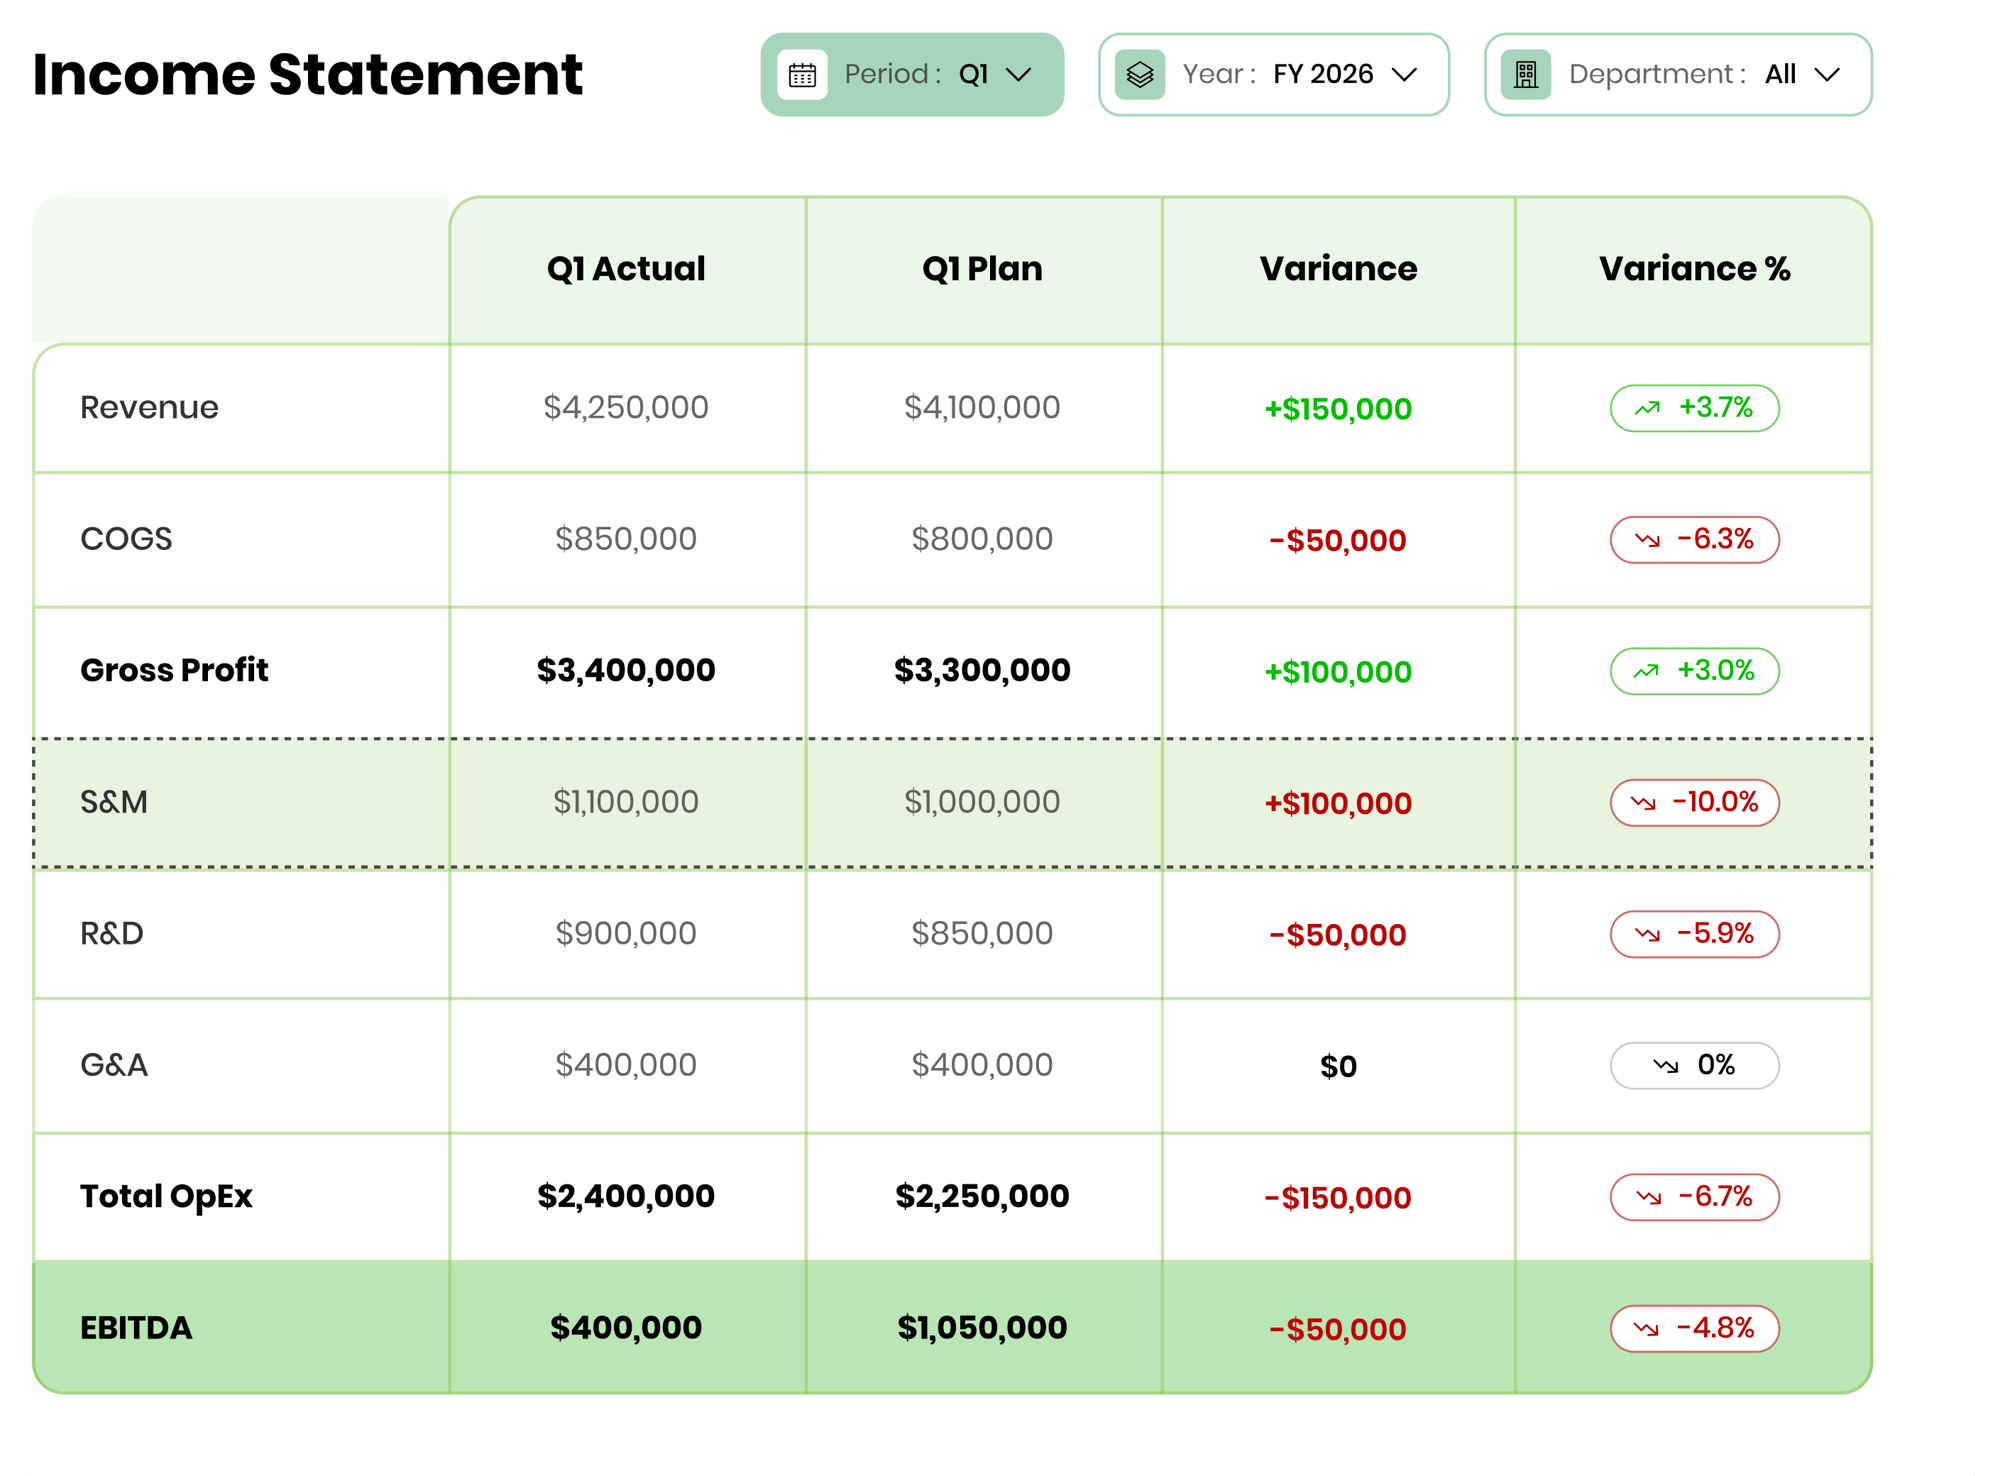
Build financial statements, management reports, and board-ready views that update automatically from your latest actuals, budgets, and forecasts.
- Refresh reports as data changes
- Compare actuals, budgets, forecasts, and prior periods
- Format reports once and keep them live
Dashboards, Drilldown & Drillthrough
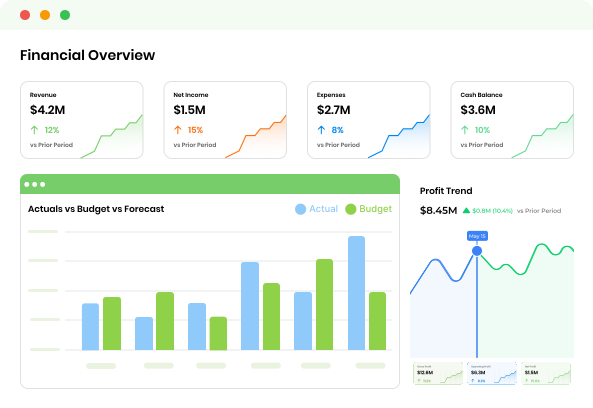
Move from dashboard performance to report detail to transaction-level details in a few clicks.
- Slice results by any reporting dimension
- Drill down into accounts, departments, funds, or business units
- Drill through to transactions to answer follow-up questions fast
Next Level Board Reports
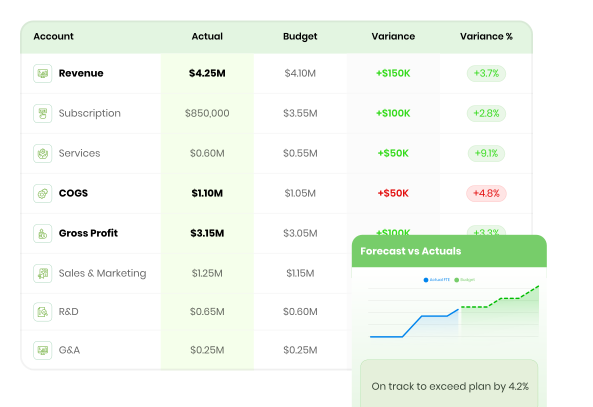
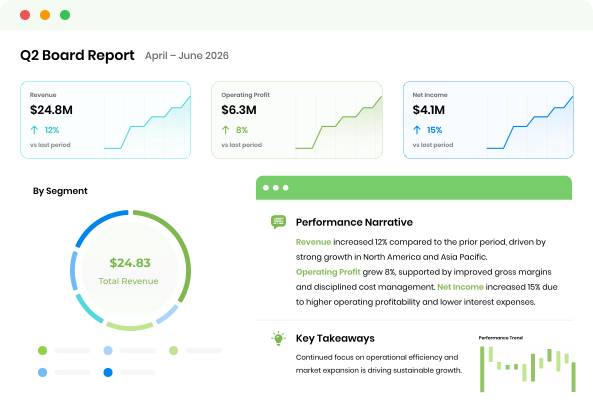
Create leadership and board packages that include the numbers, the variance story, and the supporting context.
- Auto-generate report books with current data
- Add comments and explanations directly in the report
- Attach supporting files so the story stays with the number
The Switch Was Worth It!
Teams move faster, trust the numbers, and spend far less time buried in spreadsheets.
%20(1).png?width=800&height=800&name=image%20(5)%20(1).png)