%20(1).svg)

By Limelight Team |
Last Updated: May 07, 2026

Board Intelligence research found that the average board pack has grown to around 226 pages, costs organizations close to $4 million a year to produce, and yet nearly two-thirds of directors rate them as “weak” or “poor”.
That’s a significant investment for something that often fails its audience.
Board members still arrive with unanswered questions. They flip through slides searching for context. They ask about numbers already buried somewhere in the appendix. Some disengage entirely.
The problem isn’t volume. It’s structure.
Financial data sits across systems. Commentary is written separately from the numbers. Reports are compiled manually and distributed as static PDFs that are already outdated by the time the meeting begins.
Effective board reporting looks different. It brings financial data and narrative into one coherent story. It prioritizes clarity over density. It gives board members information they can engage with, not just review. It essentially enhances board engagement.
In the sections ahead, we’ll examine what separates effective board reporting from ineffective board reports, outline a practical framework finance teams can apply, review common mistakes, and explore how modern FP&A tools are changing how board members interact with financial insight.
Board reporting is the structured process of compiling and presenting organizational performance data, strategic updates, financial results, risks, and recommendations to the board of directors.
It is not the same as management reporting.
Management reporting is granular. It tracks departmental metrics, operational activity, and a company’s financial performance day-to-day. It helps leaders run the business.
Board reporting serves a different purpose. It is strategic, concise, and decision-focused. Its role is to give board members the context they need to fulfill oversight responsibilities, evaluate performance, and guide long-term direction. The board does not need line-by-line operational detail. It needs clarity on performance, risk exposure, capital allocation, and strategic progress.
Most boards receive a mix of the following:
In theory, this mix should give the board a complete view of performance, risk, and strategy; in practice, many boards still report information overload, gaps, or poor alignment with the real decisions they need to make.
For a detailed breakdown of each component and ready-to-use formats, explore our CFO board report templates.
If you’ve ever left a board meeting feeling like the conversation never reached the right level, the problem likely wasn’t effort. It was structure.
Broken board reporting usually shows up in familiar ways.
The information exists somewhere in the board pack. It might be buried on page 47 or hidden in an appendix.
When reports are too long or poorly organized, board members spend time searching instead of thinking. Meetings become clarification sessions rather than strategic discussions.
If preparing a well-structured board report means copying numbers into PowerPoint, adjusting formatting, checking formulas, and reconciling versions, the process is consuming energy that should be spent on analysis.
The result: beautifully formatted slides with limited insight.
Many board reports are built from static spreadsheet exports. By the time the board convenes, actuals may have shifted, forecasts may have changed, and assumptions may no longer hold. Static reporting creates lag. Lag weakens oversight.
Financial data often lives in Excel. Commentary is drafted in Word or PowerPoint. Distribution happens through email.
When narrative and numbers are separated, board members must mentally reconcile them. That increases cognitive load and raises the risk of misunderstanding.
Sometimes the process becomes routine. The same slides are reused. Colors improve. Charts look cleaner. But the structure does not evolve.
The organization continues producing board reports that look better, yet function the same way. The real issue—clarity, integration, and strategic focus—remains unchanged.

Six principles of good board reporting
If your board pack is long but the meeting still turns into a Q&A on basic context, the issue is not effort. It’s how the information is arranged. Boards work best when reporting on financial information is concise, decision-focused, and tied to strategic priorities, not operational detail.
Here are six principles that separate effective board reporting from the typical board pack.
Every board report should begin with a clear question: What does the board need to decide, approve, or discuss?
Too often, board reports open with financial tables and dashboards, leaving directors to interpret what matters. Effective board reporting reverses that order. It starts with context.
For example: “We are requesting approval to reallocate $2 million toward digital expansion due to declining enrollment trends.” The supporting data then follows.
Decision-led reporting reduces ambiguity and keeps board members focused on governance rather than data interpretation.
A budget vs. actual table does not explain itself. Variances require context: Why did revenue fall short? Is it timing or structural? What actions are underway?
Writing board reports in the right way places financial data and commentary together in the same view. When numbers and narrative are separated across spreadsheets and slide decks, directors must mentally connect them. That increases friction.
When data and narrative live side by side, boards immediately understand the company’s performance story. Context, accountability, and action plans become visible at the same time.
Board Intelligence and other governance analyses show that many board packs now run to well over 200 pages, and those of larger organizations often approach or exceed 300 pages. Volume does not equal clarity.
Board reporting that moves decisions forward compresses complexity. Dashboards, trend lines, and traffic-light indicators help board members read information quickly. A single visual showing three-year revenue trends communicates more than pages of raw figures.
Visual aids help, but they can’t do the job on their own. If a chart doesn’t explain what changed and why, board members will fill in the gaps themselves. Pair every visual with a short line of context so the takeaway is clear.
Traditional board reports rely on spreadsheet exports created weeks before the meeting. By presentation day, numbers may already be outdated.
Effective board reporting connects reports directly to source systems such as ERP and accounting platforms. When a director reviews a KPI or forecast, the number reflects current data.
Live data reduces the risk of discussing outdated assumptions. It also builds trust. Directors gain confidence that decisions are based on up-to-date financial performance rather than static snapshots.
Boards operate at altitude. Their focus is strategic outcomes, risk exposure, capital allocation, and long-term sustainability.
Executives, by contrast, require operational metrics: departmental budgets, hiring plans, marketing performance, and vendor costs.
One of the most common reporting mistakes is delivering a management report to the board. Effective board reporting filters operational noise and elevates what matters at the governance level. Directors do not need to see every expense line. They need to understand trends, risk signals, and material variances.
Effective board reporting begins before the meeting.
Best practice is to distribute board reports five to seven days in advance, giving directors time to review and prepare questions. Many governance advisors recommend pairing the pack with a concise cover memo or executive summary highlighting the most important issues and decisions for discussion, typically limited to a small number of priority items.
This small shift changes meeting dynamics. Instead of reading slides aloud, leaders spend time discussing implications. Board members arrive prepared. Conversation moves faster, and oversight becomes stronger.
Together, these six principles shift board reports from static documentation to strategic instruments. They help boards move from passive recipients of information to active participants in decision-making.
Some board reports look polished and thorough, but they still get in the board’s way. They overload directors, bury the real issues, or slow decisions. These five mistakes come up often, and they’re easy to defend as “good reporting.”
When every metric, chart, and appendix gets included “for completeness,” board packs grow fast, and the key elements get harder to find. Large organizations now routinely send packs that are hundreds of pages long, yet many directors still rate them as weak or poor because they cannot quickly see priorities or risks.
Instead, build the pack around the decisions and risks the board must address, then cut anything that does not support those discussions.
A well-formatted pack that only covers last quarter’s actuals can look complete, but it doesn’t help the board evaluate what happens next. Without forecasts, scenarios, and clear views of runway and risk exposure, boards cannot challenge management’s plans or test resilience.
Instead: Make forward-looking analysis (rolling forecasts, scenario views, leading indicators) part of every board report, not an occasional add-on.
Sending spreadsheets in one attachment and commentary in another may feel efficient, but it pushes the work onto the board. When numbers and narrative are scattered across files, people, and threads, the story never lands in one coherent view.
Instead: Put key KPIs, variances, and actions together so the “what, why, and what next” are visible at a glance.
Having a single “board pack hero” can feel controlled, but it also creates a manual bottleneck. If that person is unavailable, or makes a mistake under time pressure, quality and timeliness both suffer.
Instead: Use a shared board reporting template and connected data so teams can contribute directly while finance curates, rather than rebuilds, the entire pack.
Teams often spend days refining slide layouts, colours, and fonts, and the reporting itself stays fuzzy. A beautifully branded deck with unclear risks, fuzzy recommendations, or missing options is still a poor board report.
Instead: Spend most prep time sharpening the questions, actionable insights, and decision options, then treat design as a light final pass.
Use this checklist to quickly assess where your current board reporting stands and what to upgrade next.
Reports distributed at least 5–7 days before meetings so directors have time to read and prepare.
Data and narrative unified in a single, coherent document rather than stitched together from separate tools or attachments.
Most board reporting still runs on a familiar workflow. Finance exports data from the ERP into Microsoft Excel, builds charts, and then copies those charts into PowerPoint or Word. Commentary gets written in a separate document. Everything is bundled into an email and sent as a static pack. Some board members print it. Others skim it on a tablet. By the time the meeting starts, the numbers may already be out of date.
Then the meeting turns into a slide walkthrough instead of a conversation about what the numbers mean.
This process feels “normal” because it’s been the default for years. But it creates drag at every step. Data gets copied instead of staying connected. Narrative sits apart from the tables it’s meant to explain. Collaboration happens through version control, email threads, and last-minute edits. And every quarter, the cycle starts again.
Next-level board reporting looks different. Instead of exporting and stitching information together, finance teams author the board report in a single document where live data, charts, narrative, images, and even video sit side by side. Financial tables pull directly from the ERP. Charts auto-update as actuals change. Commentary lives right next to the numbers it explains.
It also changes how teams work together. Multiple contributors can collaborate in real-time. A forecast owner updates assumptions while a controller reviews variance commentary. Comments and edits stay in one place. Data lineage is clear. And when a board member wants to understand a KPI, they can drill into the detail behind it rather than rely on a static screenshot.
This is where Limelight Docs comes in.

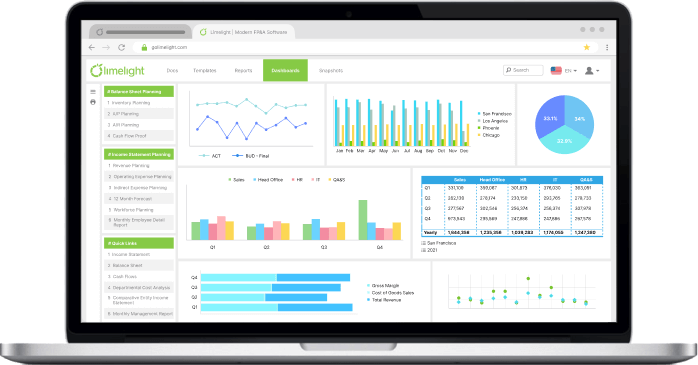
Limelight FP&A platform homepage
Limelight Docs is a feature within the Limelight financial planning and analysis (FP&A) platform that combines live financial data with written narrative in one connected document. Instead of copying charts from Excel, finance teams embed auto-updating tables, graphs, and dashboards directly into their board reports.
Teams can also add videos, images, and rich media alongside financial data. For example, a nonprofit board report might include a financial performance dashboard next to a short video update on program outcomes. The board sees both performance metrics and impact in the same place.
The experience feels like a modern collaborative workspace, but built natively inside an FP&A platform. That means the numbers stay tied to source systems. They update automatically. There is no manual re-entry.
Limelight Docs supports real-time collaboration. Multiple team members can author simultaneously, with comments and data lineage. Finance can shape the narrative while keeping reporting grounded in live numbers.
It is ideal for:
Organizations already using Limelight have seen measurable improvements. Chicago Public Media reported reduced data entry errors and faster reporting cycles after moving away from spreadsheet-based processes. Communication Services for the Deaf cut budget cycle times in half by centralizing planning and reporting within Limelight. In a testimonial, Ben Daniel highlighted the improved transparency and speed of financial reporting once data and narrative were connected in a single platform.

Client testimonial from Ben Daniel, Director of FP&A at CSD
A board doesn’t need more complex data. It needs clarity on what the data means.
See how Limelight helps finance teams build next-level board reports. Request a demo.
Effective board reporting is the structured delivery of financial results, strategic updates, risks, and recommendations to a board of directors in a clear, decision-focused format. Governance research consistently shows that directors value concise, forward-looking reporting that supports oversight rather than operational detail. The goal is informed decision-making, not data volume.
A strong board report typically includes financial statements (income statement, balance sheet, cash flow), budget vs. actual comparisons, key performance indicators, risk updates, and strategic initiative progress. Many governance best-practice guides recommend pairing these reports with an executive financial summary that highlights key decisions and material variances. The emphasis should be on clarity and materiality.
Present data visually and with context. Use trend charts, dashboards, and variance summaries rather than dense tables. Pair each metric with a short explanation of what changed and why.
Board reporting focuses on strategic performance, governance, risk exposure, and long-term sustainability. Management reporting is operational and granular, supporting day-to-day decisions. Directors need high-level insight and forward-looking analysis, while executives require detailed metrics for execution. Mixing the two often leads to information overload at the board level.
Modern FP&A software connects live financial data to dashboards and narrative documents, reducing manual exports and version control issues. Instead of static spreadsheets, reports pull directly from ERP systems and update automatically. This improves accuracy, shortens reporting cycles, and allows boards to review current data rather than outdated snapshots.
Subscribe to our newsletter