

Compare the Numbers. Explain the Difference.
Share the Right View.
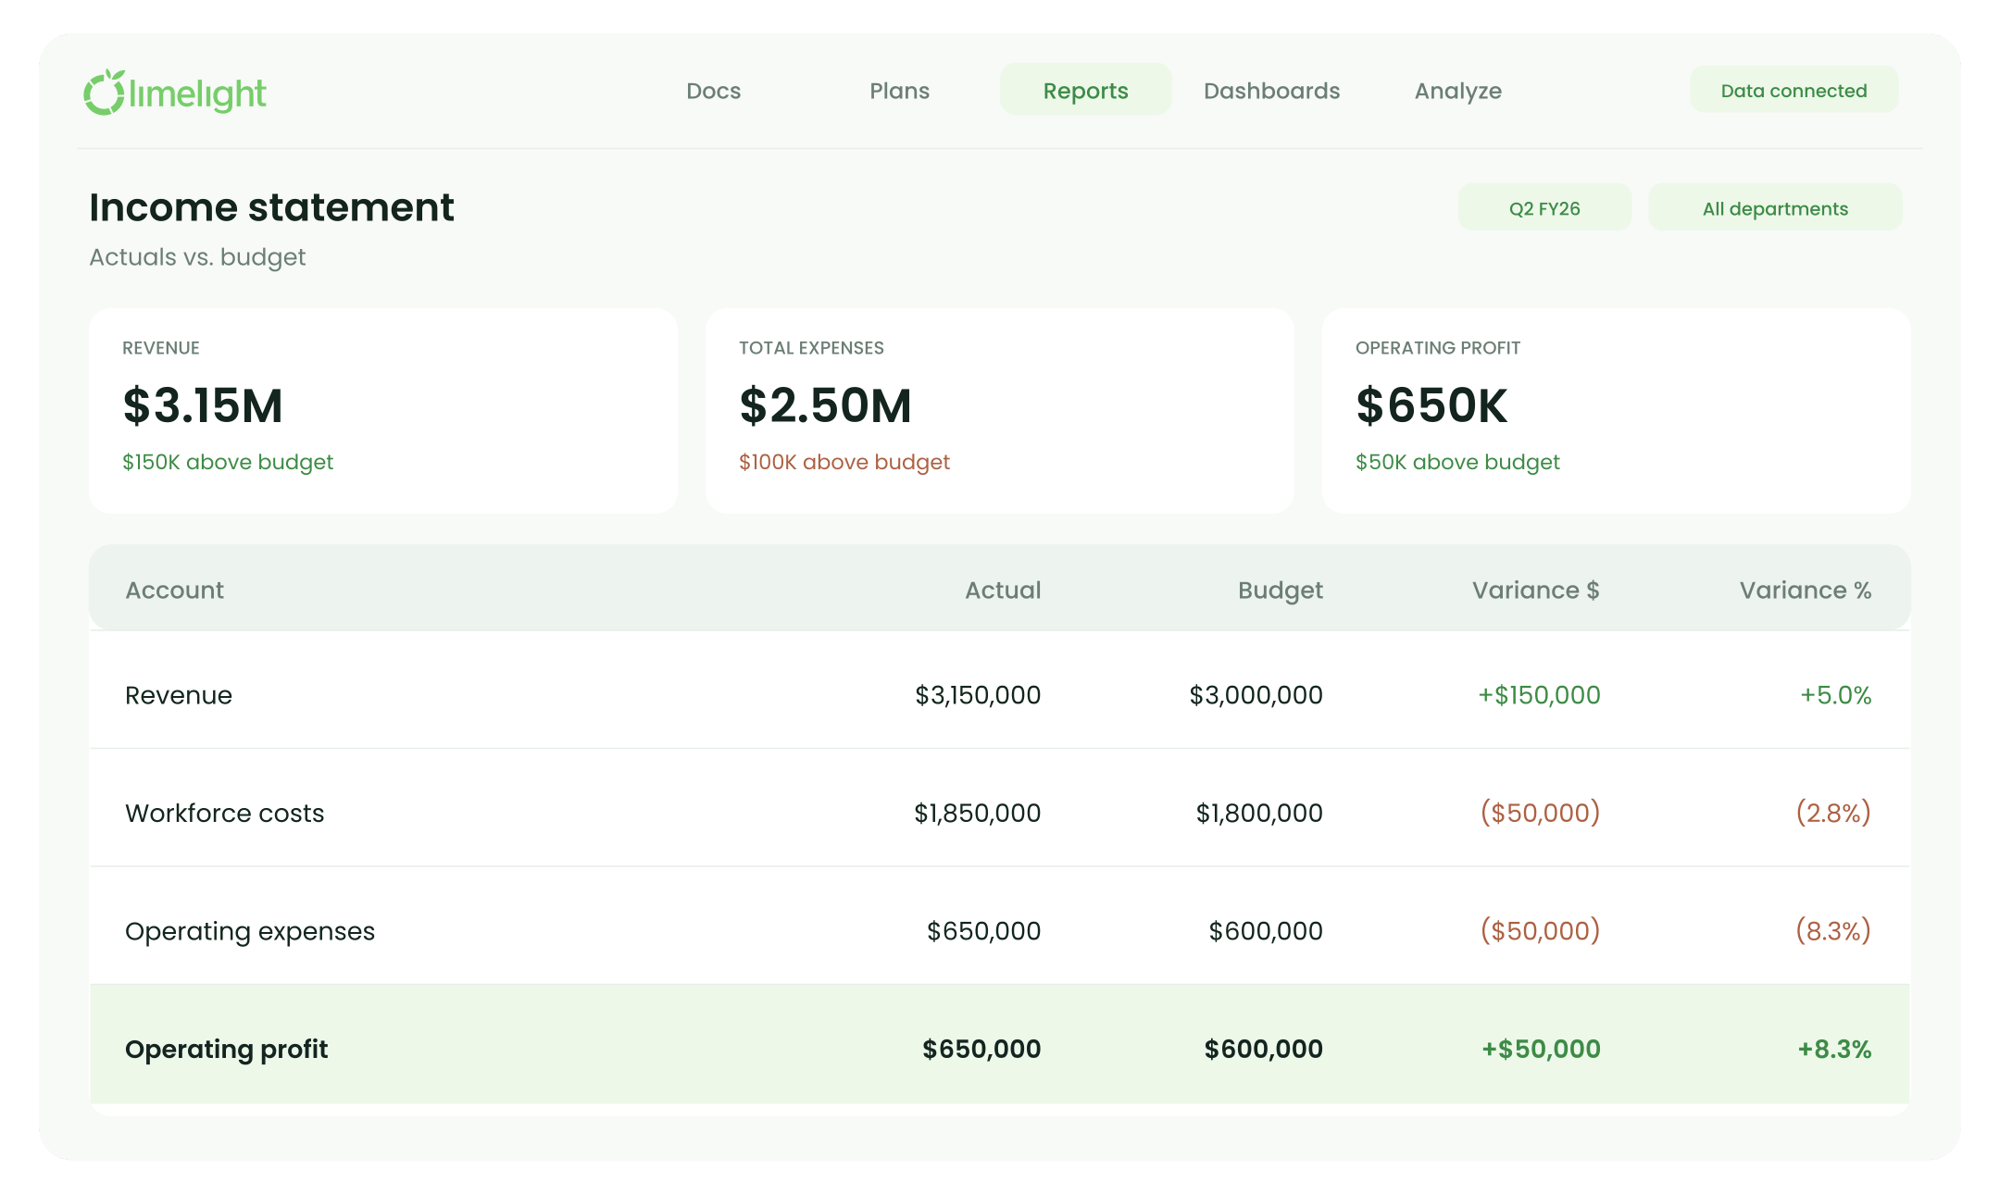
From monthly reviews to board meetings, give your team reports that answer practical questions: Are we on budget? What changed? Where do we need to act?

Compare Performance Against Plan.
Put actuals, budgets, forecasts, and prior periods side by side. See where revenue and spending differ from expectations.

Get to the Detail Behind the Variance.
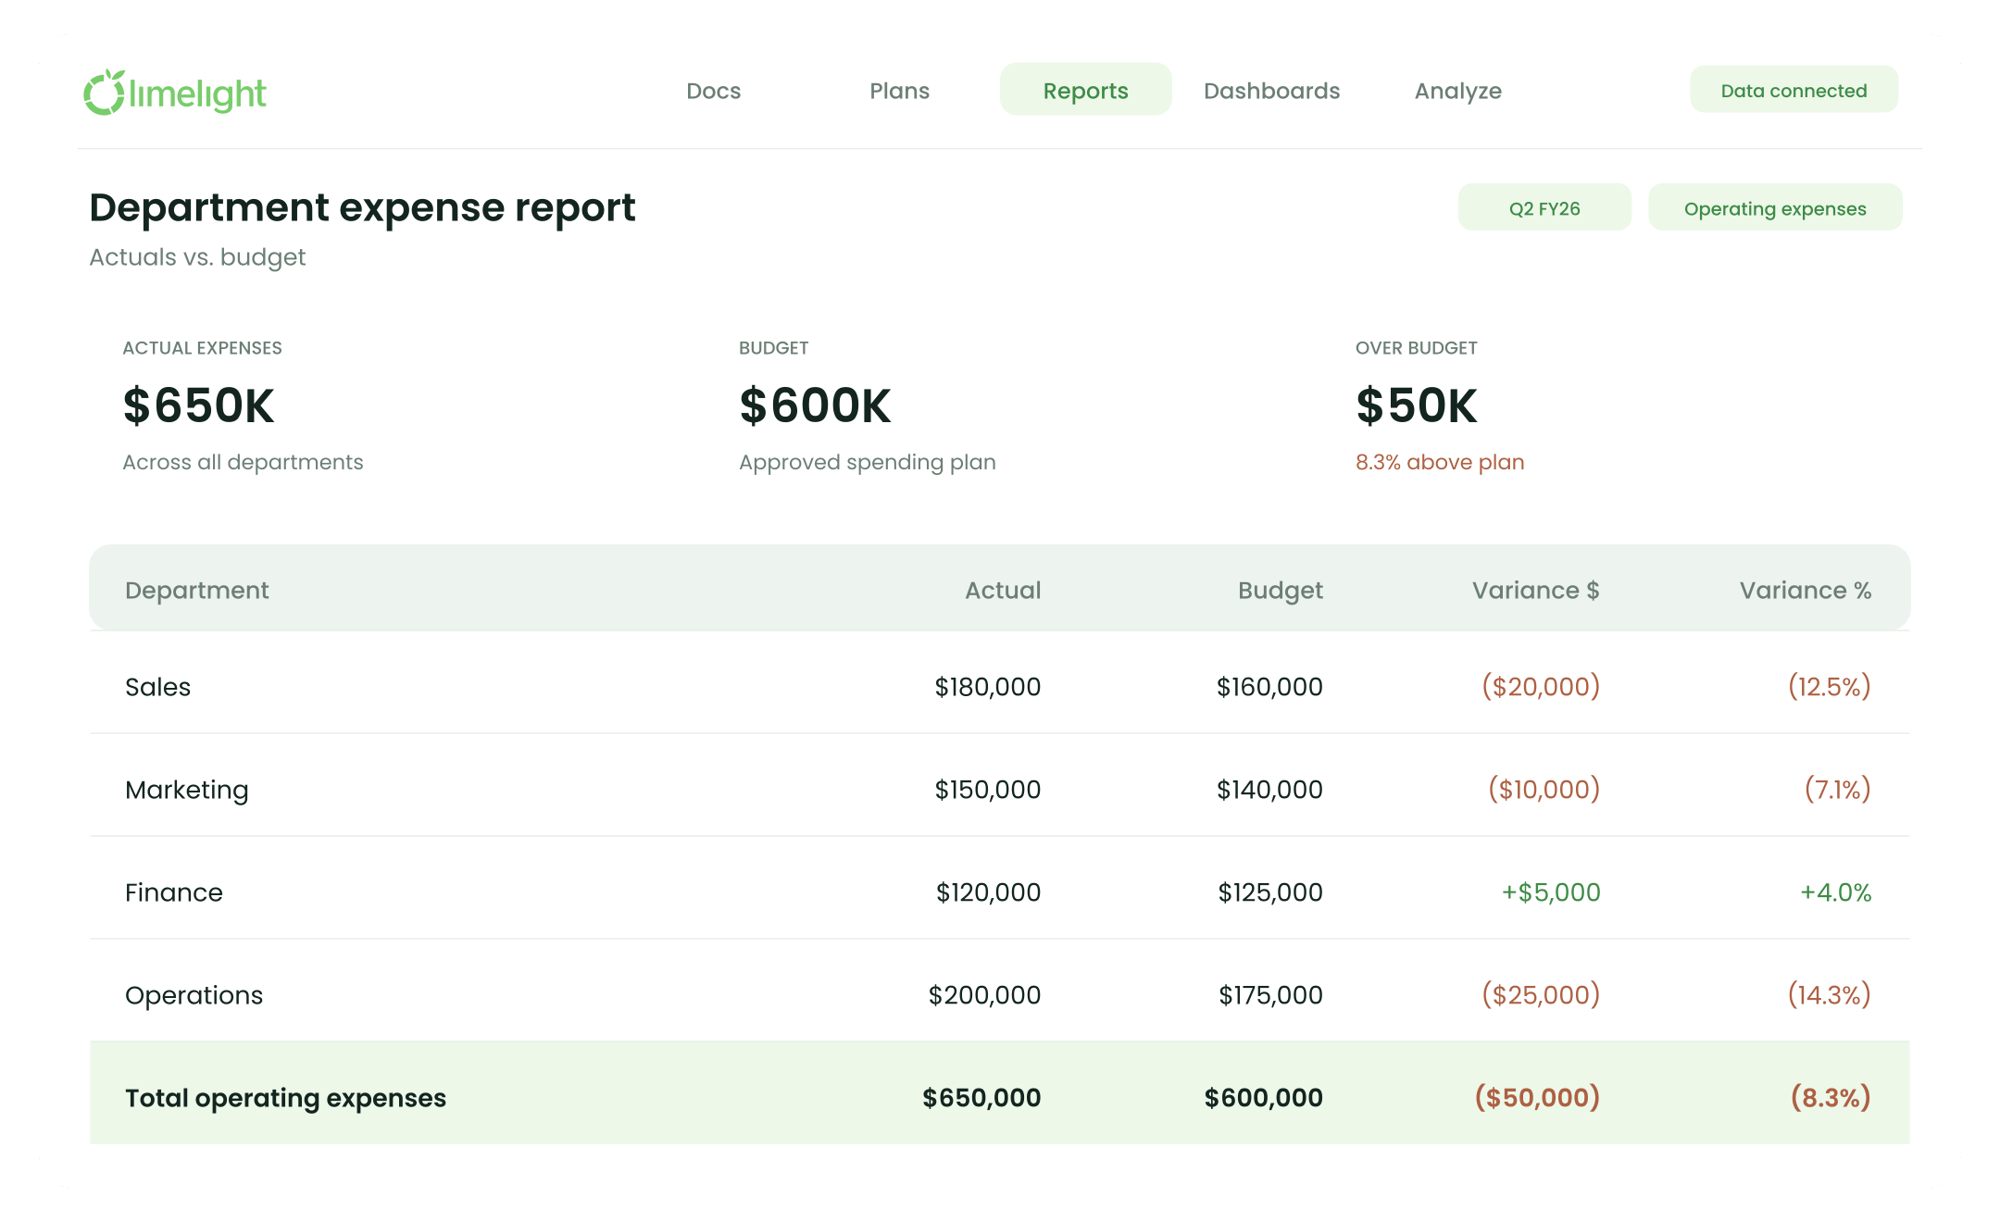
Explore results by account, department, entity, or fund. Drill through to supporting transactions to investigate what changed.

Analyze Deeper
Financial Statements & Variance Reports
Build income statements, balance sheets, cash flow statements, and variance reports around the way your team reviews performance. Keep the layout you need and refresh the numbers as connected data updates.
- Compare actuals with budgets, forecasts, and prior periods
- Review results by month, quarter, or year
- Reuse formatted reports across reporting cycles
Dashboards & Detailed Analysis
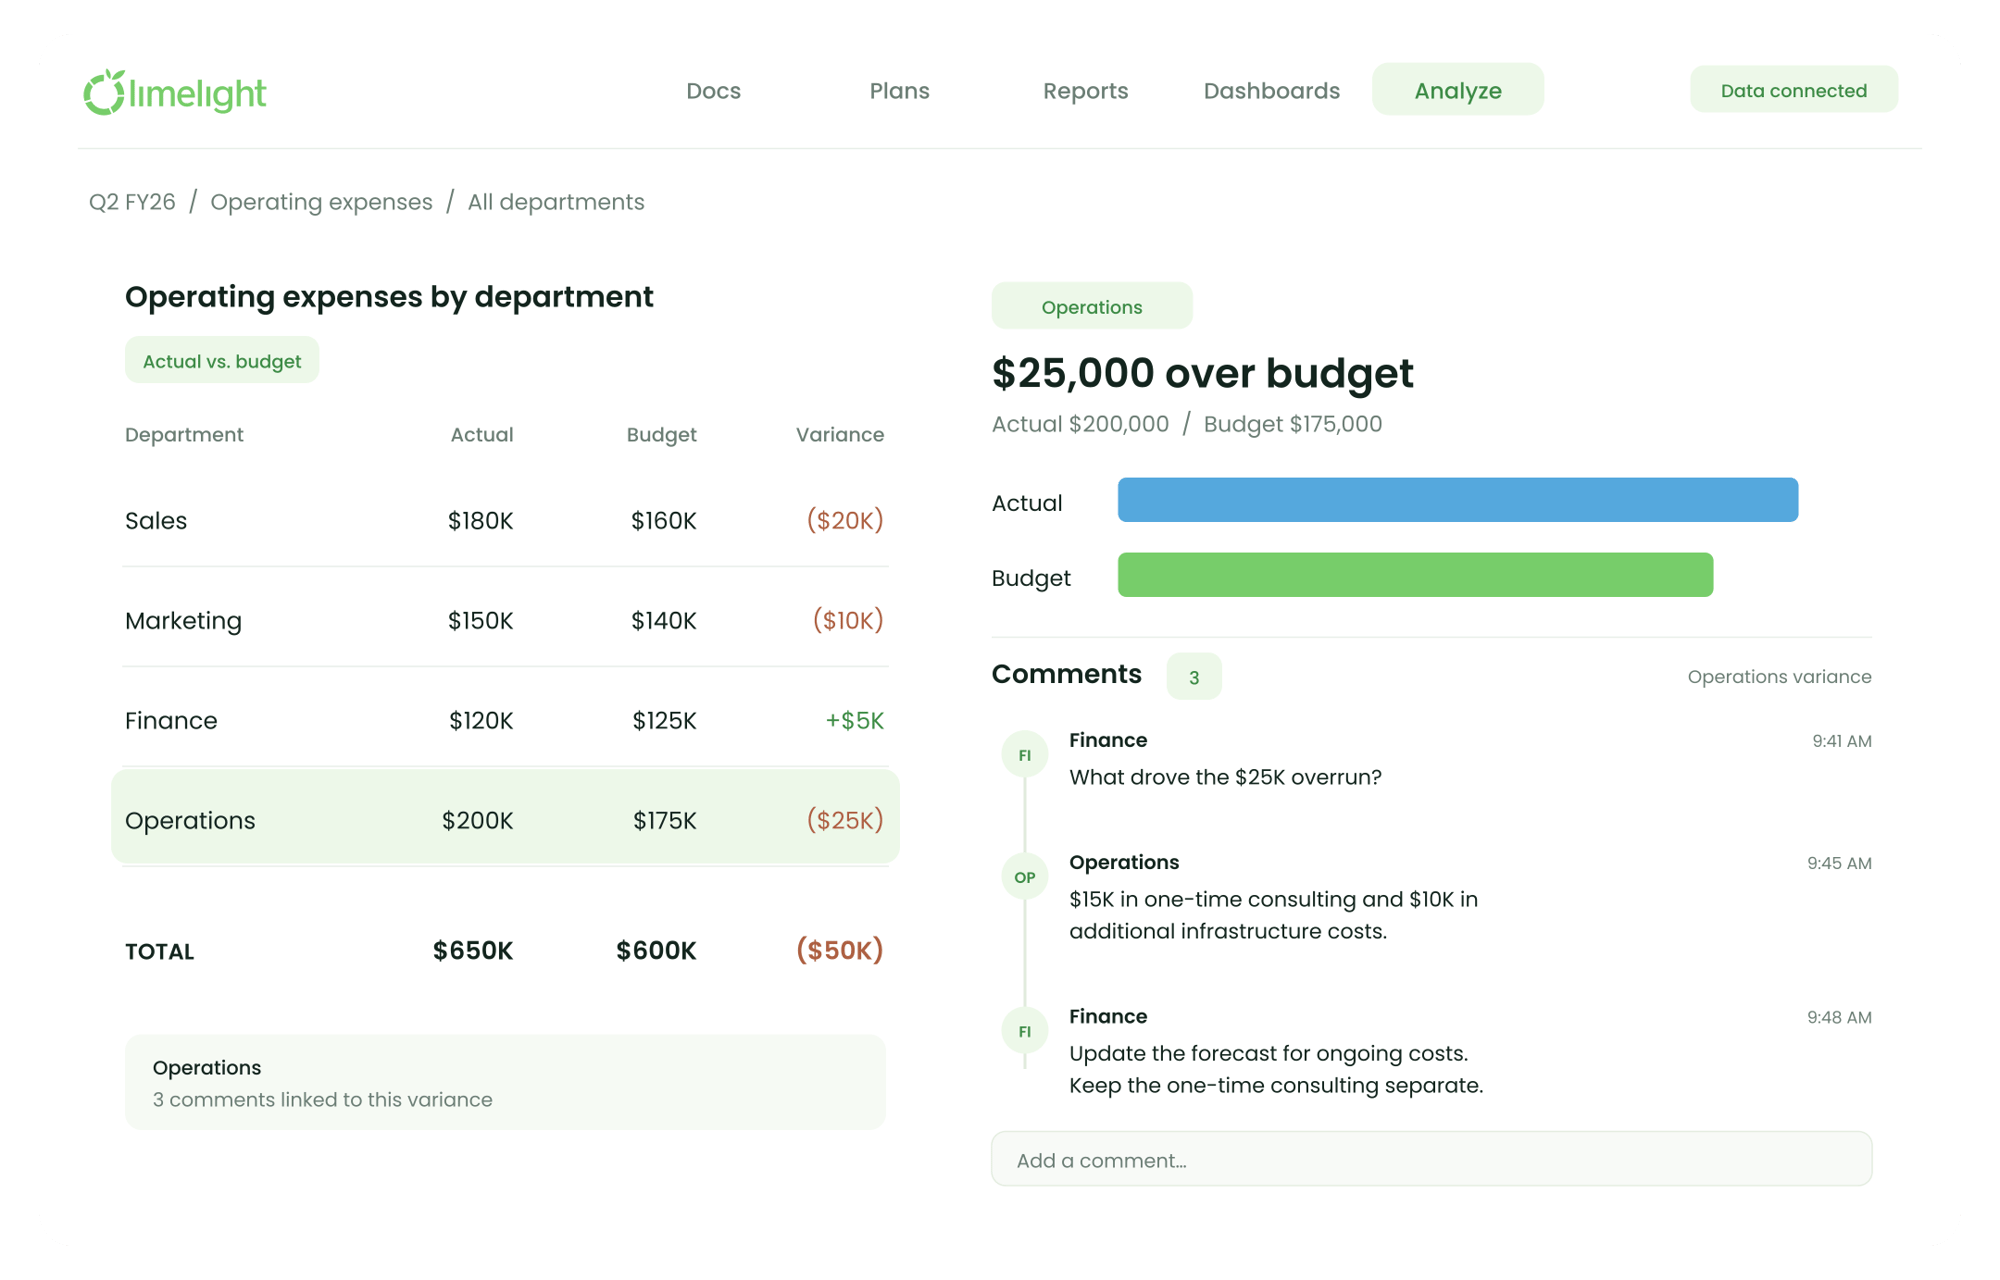
Start with the financial picture, then work through the details. Use dashboards and reporting dimensions to understand which departments, accounts, or business units are behind the result.
- Track financial KPIs and performance against plan
- Drill down by account, department, entity, or fund
- Drill through to supporting transaction detail
Management & Board Reporting
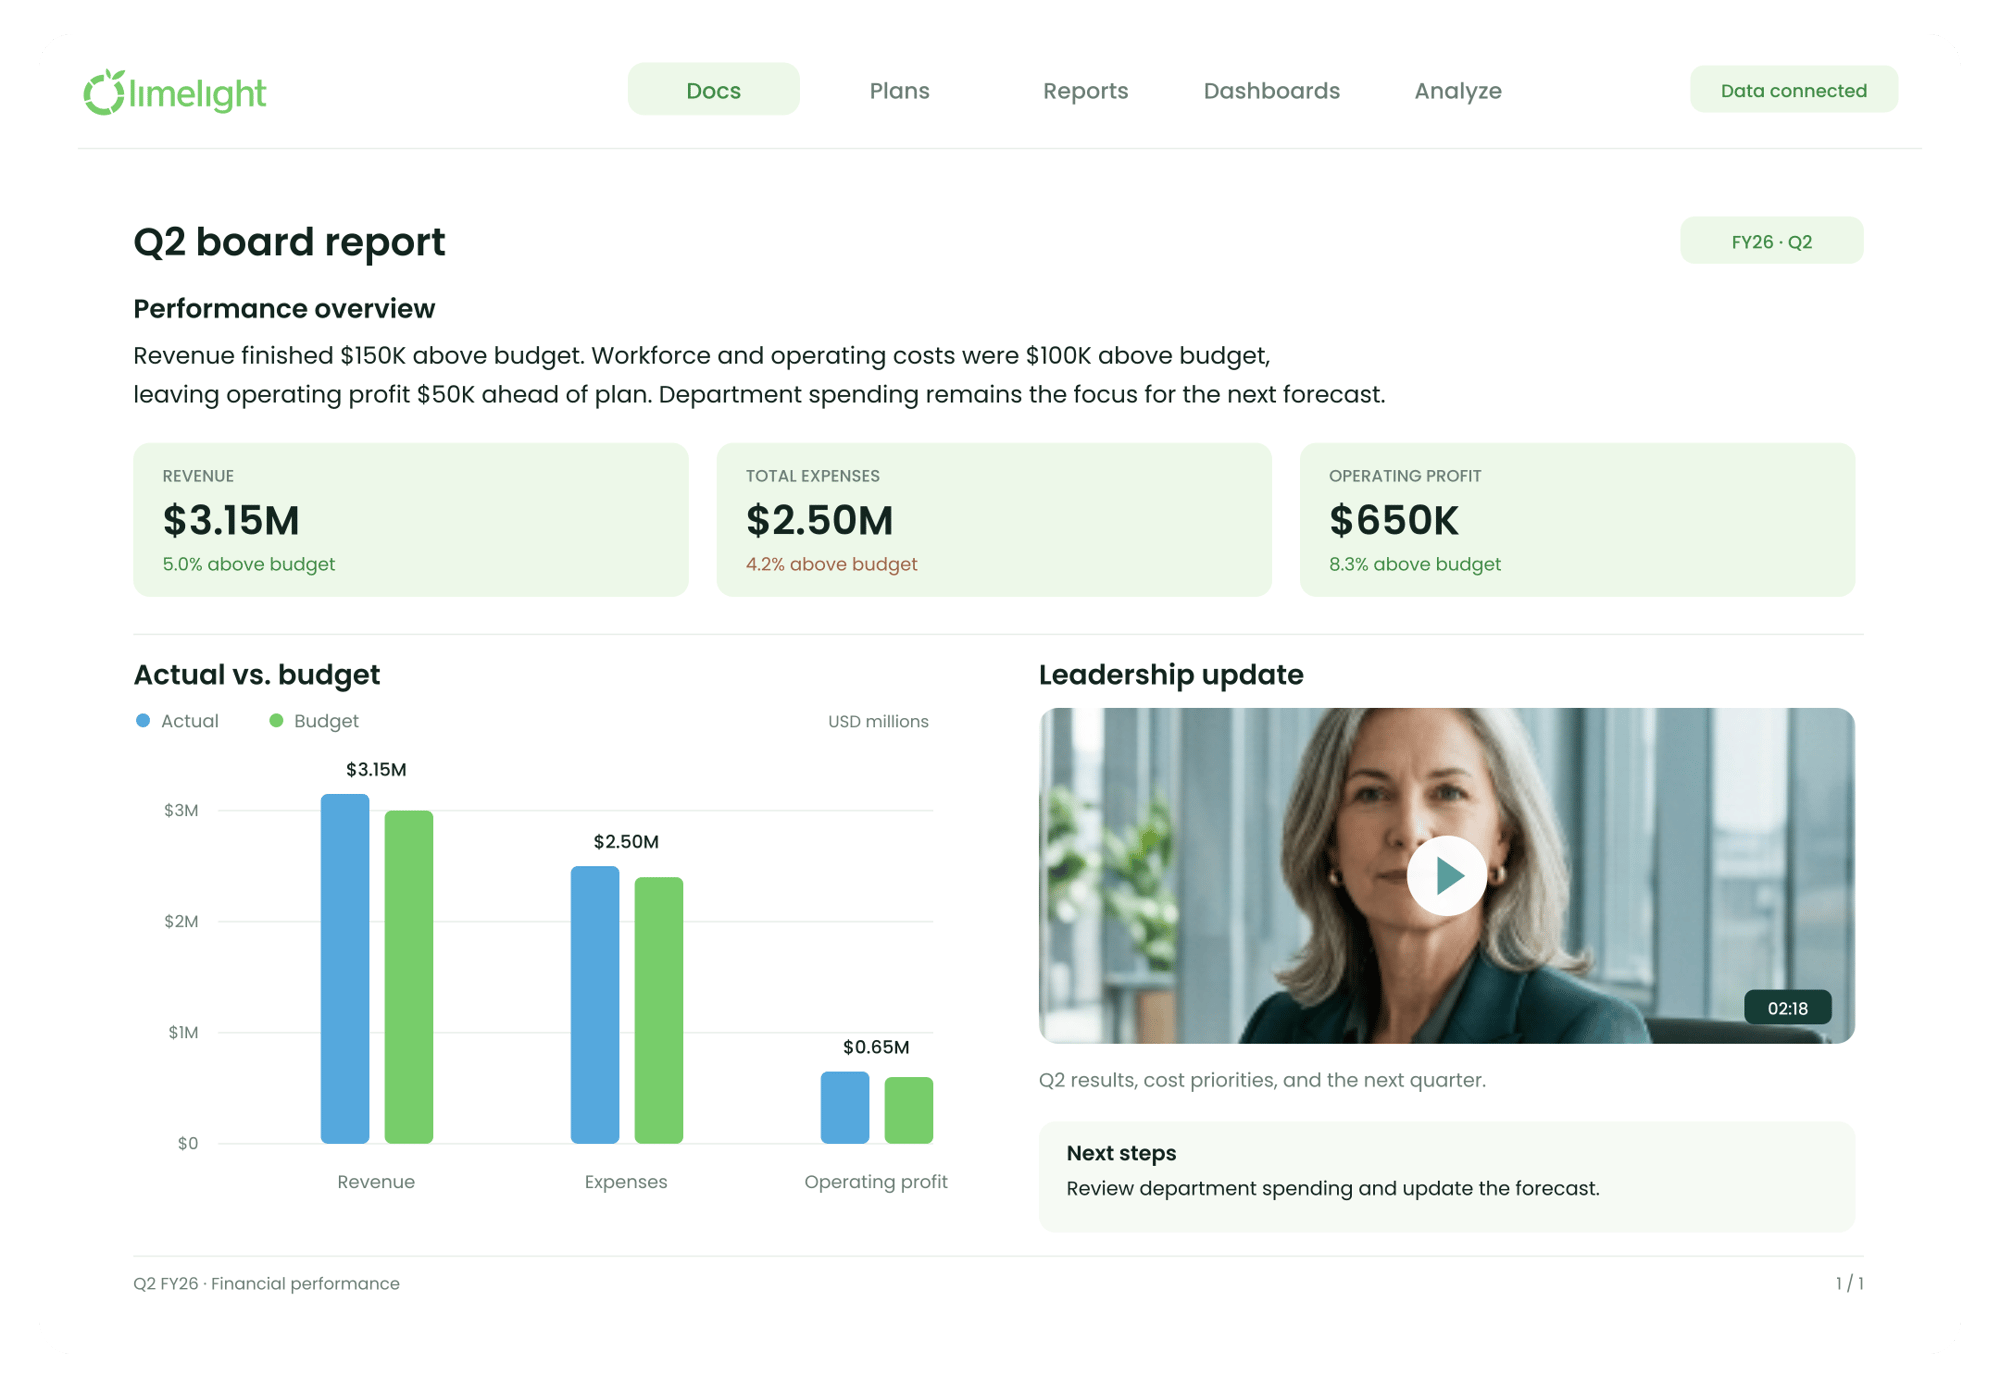
Build management and board packages from connected reports. Add explanations and supporting files, then generate report books that bring the financial picture together for leadership.
- Combine financial reports into repeatable report books
- Keep comments and attachments beside the numbers
- Use Limelight Docs for narrative reports and executive updates
The Switch Was Worth It!
Teams move faster, trust the numbers, and spend far less time buried in spreadsheets.

The modern Excel interface made adoption easy, while automation eliminated manual reporting and made forecasting faster and more reliable.
Pauline Poompan
Less Spreadsheet Work. More FP&A Power.
Book a demo and see how your finance team can plan faster, find answers sooner, and keep the business moving.
