Instant Insights, Always in Reach
Available around the clock, these dynamic dashboards provide immediate insights into key financial metrics.
Advanced Dashboard Features
Consolidate all your financial data in a modern, trustworthy, and easy-to-use interface
Your Financial Command Center
With customizable widgets, you can tailor your dashboard to focus on the data that matters most to you, whether it's cash flow, budget vs. actuals, or key performance indicators (KPIs).
Interactive Visualizations
Our interactive visualizations allow you to explore your data from multiple angles, uncovering trends, anomalies, and opportunities you might otherwise miss. Drill down into specific details, filter data by relevant criteria, and interact with your charts and graphs to gain a deeper understanding of your financial performance.
Collaborate & Share
Easily share dashboards with stakeholders, add comments and annotations, and work together to analyze data and make informed decisions that move your organization forward.
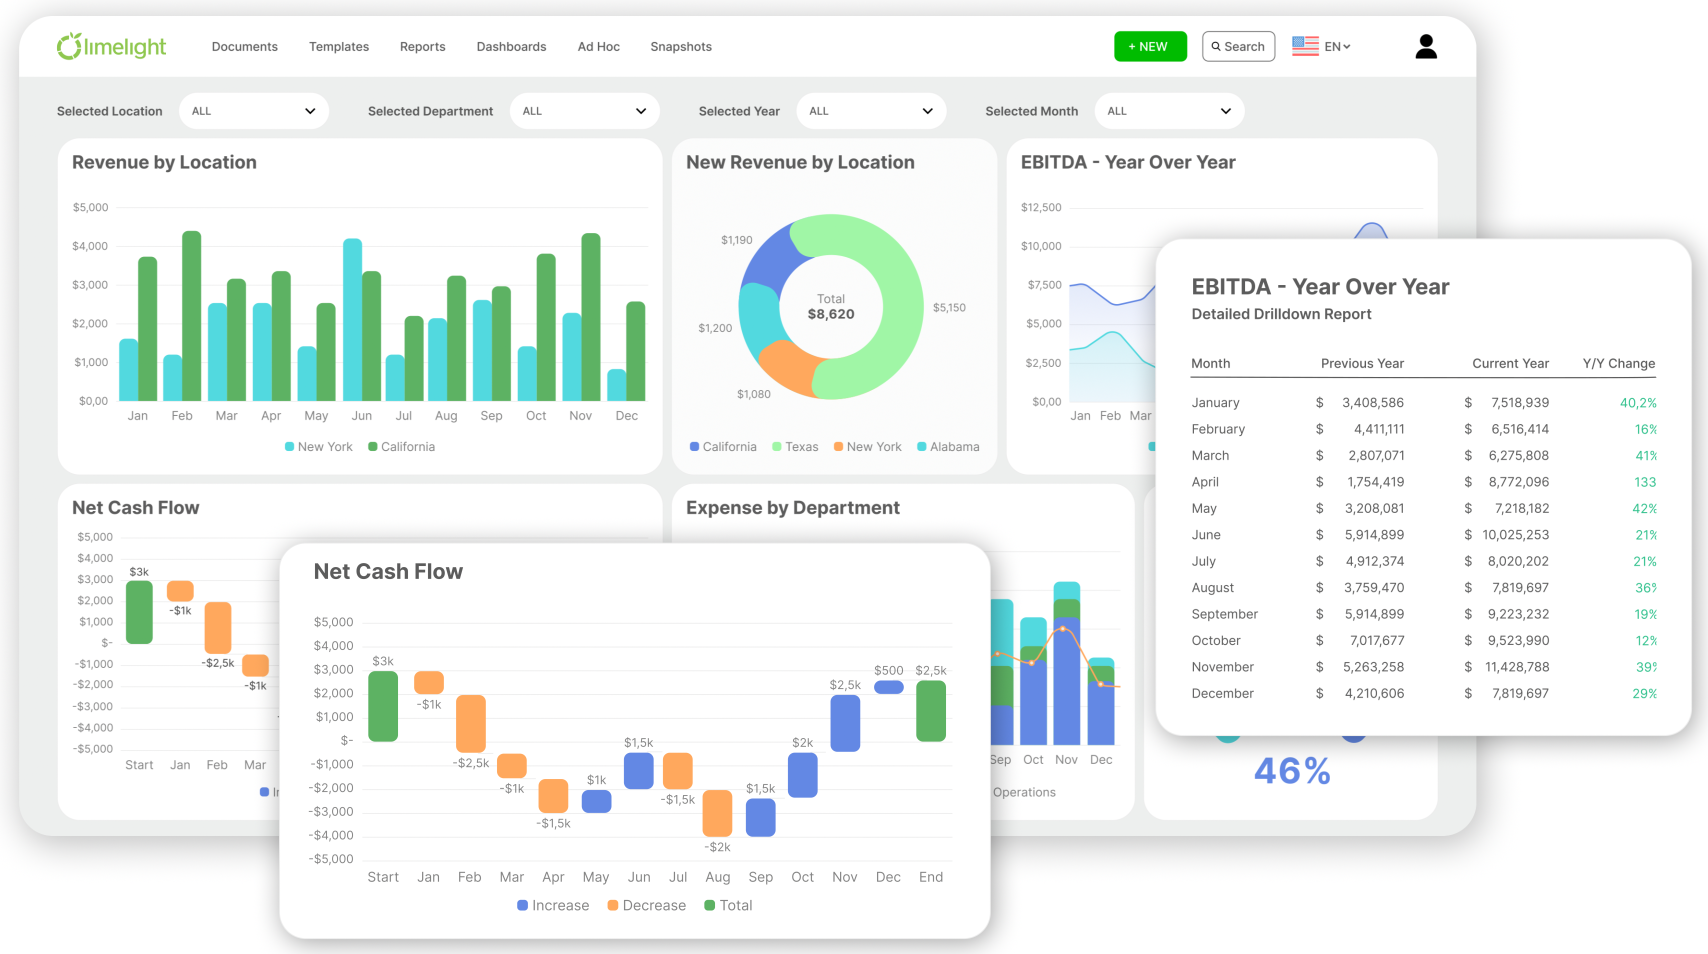
Drag-and-Drop Design
Easily create and customize your dashboard layout with our intuitive interface.
Variety of Widgets
Choose from a library of pre-built widgets (charts, graphs, tables, etc.) or create your own.
Real-time Data
Your dashboard updates automatically as your data changes, so you're always working with the latest information.
Drill-down
Explore your data in greater detail by drilling down into specific categories, time periods, or accounts.
Dynamic Filters
Quickly filter your data to focus on specific areas of interest.
2-Minute Dashboard Demo
Limelight powers some of North America’s fastest growing companies
Frequently Asked Questions
Interactive dashboards help finance teams visualize financial data and monitor KPIs in real time.
Instead of exporting spreadsheets or manually building charts, teams can track revenue, expenses, cash flow, and budget performance in one centralized view. This improves visibility and makes it easier to communicate financial insights across the organization.
Interactive dashboards help finance teams visualize data, track KPIs, monitor performance, and communicate insights clearly — all in real time without exporting spreadsheets or building manual charts.
A strong financial dashboard should include customizable charts, real-time data updates, KPI tracking, drill-down capabilities, and flexible filtering.
It should also allow users to analyze trends, compare budget versus actual performance, and share insights easily with stakeholders. The goal is to provide clear, actionable financial analytics without manual report preparation.
Limelight provides real-time financial dashboards that are fully customizable and built on centralized data.
Users can drag and drop metrics, apply filters, drill down into transactions, and analyze financial performance at the department, entity, or account level. Because dashboards are connected directly to integrated financial systems, data stays current without manual updates.
Yes. Limelight dashboards can be shared across teams to improve collaboration, align decisions, and ensure everyone has access to the same real-time insights.
Yes. By visualizing data and trends in real time, interactive dashboards help decision-makers spot opportunities, identify risks, and respond faster than static reports.
Finance leaders, analysts, executives, and business managers benefit by getting instant visibility into performance, trends, and financial health without relying on manual reporting.
Cloud-based dashboards offer real-time updates, secure access from anywhere, seamless collaboration, and scalability — enabling teams to work with up-to--date data anytime.
Plan better. Report faster.
We'll show you what automated FP&A looks like and how easily you can build reports.