%20(1).svg)
8 CFO Board Report Templates and Best Practices for 2026
By Laks Satchi |
Last Updated: June 23, 2026
CFO board reports are essential for strategic decision-making, requiring clear, concise, and actionable data presentation to guide financial insights and align organizational goals.
Manual board reporting is time-consuming, with finance teams spending over 120 hours per quarter, risking errors and outdated insights, which can be automated for efficiency.
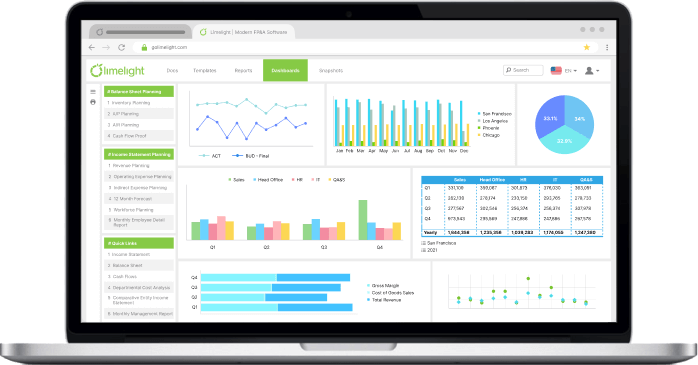
Limelight FP&A offers advanced board reporting tools, featuring Excel-free platforms with real-time data updates, collaborative tools, and interactive dashboards to streamline financial communication.
Key components of an effective CFO board report include executive summaries, financial statements, KPIs, variance analysis, risk management, and actionable insights, ensuring comprehensive financial health representation.
Limelight's pricing starts at $1,400 monthly, offering scalable solutions with features like pre-built templates and automated workflows, designed to enhance financial reporting accuracy and speed.
Imagine a board meeting derailed by confusion: directors struggling to make sense of cluttered financials and asking repeated questions about unclear metrics while you don’t have the data at hand to provide the full context.
This isn’t a hypothetical. It’s a real challenge many CFOs and their teams face.
According to Consero Global's 2024 CFO survey, 30% of the investor-backed CFOs cite timely and accurate reporting as the top challenge they’re concerned about, whereas 25% struggle with gaps in financial reporting systems.
When board reports are vague, disorganized, or incomplete, they can erode trust, delay decisions, and undermine leadership credibility. One poorly prepared report can shift the focus from growth opportunities to damage control, leaving lasting repercussions.
But when CFO reports are clear, comprehensive, and aligned to what the board needs to know, they become a powerful tool. They enable CFOs to deliver strategic insights, build trust, and drive alignment.
In this article, we’ll break down what it takes to create effective board reports: ones that present performance, variances, and metrics with clarity and confidence, and help you lead more productive, high-impact meetings.
A CFO board report is more than just a collection of numbers. It’s a strategic tool that helps board members understand your company’s financial health, make informed decisions, and steer the business toward its goals.
Here are the essential components every effective CFO board report must include:
Your report should begin with a short, clear overview of the company’s current financial status and major highlights. Board members are busy and need a quick snapshot before diving into the details. A concise summary sets the stage and draws attention to urgent issues or achievements.
For instance, if revenue is up but profit margins are down, the summary should flag this trend immediately so the board can focus on root causes and solutions.
This includes the income statement, balance sheet, and cash flow statement. These foundational statements help the board understand profitability, assets, liabilities, and liquidity and gauge overall financial health.
Let’s say there’s a sudden drop in cash flow, even if profits look strong. It could signal trouble paying suppliers or funding growth.
KPIs and ratios highlight vital metrics like revenue growth, gross margin, cash burn, customer acquisition cost, and debt-to-equity ratio. They turn raw data into actionable insights, revealing performance gaps and tracking progress toward goals.
For example, if your customer acquisition cost is rising faster than revenue, the board can discuss adjusting the marketing strategy.
Variance analysis compares actual results to the budget or forecast, explaining significant differences. It helps the board understand deviations from expectations and whether corrective action is needed. If expenses are consistently over budget, the CFO can explain whether this is due to strategic investments or uncontrolled spending.
Limelight FP&A simplifies this process by offering powerful tools and features designed to automate, streamline, and enhance the accuracy of variance analysis. Here's how Limelight helps:
Highlight current and upcoming risks (e.g., market downturns, regulatory shifts) along with financial forecasts. Boards need visibility into what could go wrong and how prepared the company is. Forecasts also support planning and resource allocation.
For instance, flagging a potential supply chain disruption allows the board to discuss contingency plans before problems escalate.
Link financial results to broader business goals such as market expansion, operational efficiency, or new product launches. Boards want to understand how financial performance supports strategy, not just standalone metrics.
If a new product launch is behind schedule, the CFO can outline the financial impact and mitigation steps underway.
Your reports must provide an easy interpretation of the data, with clear suggestions for next steps. Boards rely on the CFO not just for information, but for guidance on what actions to take.
This could mean recommending cost-saving measures, capital reallocation, or exploring new revenue streams based on current trends.
Use charts, graphs, and tables to simplify complex data. Visuals help board members quickly grasp trends, outliers, and comparisons across time or benchmarks.
For example, a graph showing declining margins over multiple quarters can prompt a focused discussion on operational efficiency.
Honest disclosure of challenges, risks, and uncertainties builds trust and enables productive discussions. Proactively addressing anticipated questions demonstrates preparedness and professionalism.
For instance, explaining the implications of a recent regulatory change up front reassures the board that management is on top of compliance.
Manual board report preparation creates systemic issues that drain resources and diminish your finance team's strategic value.
Time drain: Your team spends over 120 hours per quarter collecting data, building charts, and writing analysis. That's precious time that should be dedicated to strategic planning and value-added activities.
Error risks: Each manual step introduces the potential for errors. Data inaccuracies can mislead board decisions and jeopardize regulatory compliance.
Data silos: Information scattered across disconnected systems leads to fragmentation. This results in information asymmetry between the board and management, hindering informed decision-making.
Outdated insights: By the time reports are compiled, market conditions may have shifted. Boards make decisions based on obsolete data, missing opportunities, and failing to address emerging risks promptly.
Hence, the real cost isn't just inefficiency, it's the lost opportunity for your team to provide strategic analysis and proactive planning.
In the subsequent sections, we will explore best practices and tools to overcome the manual board reporting inefficiencies.
As CFO, your role in board meetings is pivotal. You provide the financial insights that guide strategic decision-making.
Standardized board report templates help present complex financial data in a clear, concise, and actionable format. With them, you can generate consistent reports that facilitate quick comprehension and more productive discussions.
Below are 10 must-have board report templates that every CFO should incorporate into their reporting process.
Using these templates makes board meetings more focused, efficient, and aligned with your company’s strategic goals.
Purpose: Provides a high-level snapshot of financial and operational performance. Gives the board a quick read on the business without diving deep into spreadsheets.
It includes:
Template:
Purpose: It condenses the income statement, balance sheet, and cash flow statement into a simplified, board-friendly view. It includes:
Purpose: Highlights performance versus plan. Helps the board understand where the business is over- or underperforming and why. It includes:
Download our free budget vs actual Excel template
Purpose: Gives the board forward-looking visibility into where the company is headed. Shows updated full-year projections, key assumptions, and how outlooks evolve over time.
Purpose: Connects financial performance with operational execution. Customizable based on your company’s industry or business model. It includes:
Purpose: Ensures the board understands short-term liquidity risk and runway. Especially critical in high-growth, capital-intensive, or uncertain markets. Template includes:
Template:
Purpose: Tracks progress on major projects or capital expenditures approved by the board. Template includes:
Template:
Purpose: Links workforce strategy with financial planning. Boards increasingly expect visibility into talent-related investments and risks. Template includes:
Tailoring these templates to your company’s unique needs and supplementing them with additional reports when needed ensures your board is well-informed, aligned, and equipped to make the right strategic calls.
Here are six best practices to ensure your reports tell a complete story and lead to productive, strategic discussions with board members.
Understanding the board’s background, expectations, and strategic priorities is essential. Customize your presentation to their level of financial expertise and focus on what matters most. If your board includes non-financial members, use less jargon and more plain language—emphasizing business impact over technical detail.
Honesty builds trust. Present both positive results and challenges clearly, and never hide bad news. Proactively address potential concerns or risks before they become issues.
If sales have dropped, explain the reasons and the corrective steps being taken, rather than waiting for board members to raise the issue.
Highlight the most critical KPIs and trends that drive business performance. Avoid overwhelming the board with too much data. Instead, synthesize information into meaningful insights that save time and support decision-making.
Instead of listing every metric, spotlight revenue growth, cash flow, or customer churn and explain what they mean for the company’s future.
Complex data is easier to understand when presented visually. Use charts, graphs, and dashboards to highlight trends and frame your data within a clear narrative that ties financials to business goals.
For example, show a line graph of quarterly revenue alongside a brief explanation of how a product launch influenced a trend.
Limelight’s interactive visualizations
Tools like Limelight come with dynamic dashboards that help you create such data-rich interactive visuals effortlessly, in seconds.
Numbers alone aren’t enough. Explain the “why” behind the results, and offer clear, actionable next steps. This helps the board understand implications and make informed decisions.
If profit margins are shrinking, share the underlying reasons (e.g., rising input costs), and recommend specific actions like renegotiating contracts or adjusting pricing.
Automating data collection and reporting streamlines the entire board reporting process by saving time, reducing human errors, and ensuring data consistency. This allows finance teams to focus on analysis and strategic insights instead of repetitive manual tasks.
For example, GSW Manufacturing, a leading automotive company, saved $400,000 using Limelight’s automation capabilities. The company reported 30X faster budgeting and significantly shorter reporting cycles.

Limelight board reporting feature overview
Limelight FP&A's board reporting tools equip finance teams with powerful capabilities to create, customize, and distribute board-ready reports efficiently. The platform is specifically designed to streamline financial communication by offering real-time insights, seamless collaboration, and automated workflows, effectively replacing cumbersome Excel-based processes.
It is an Excel-free, cloud FP&A platform, which emphasizes ease of use and provides dynamic dashboards, ad-hoc reporting, and drill-down functionality. All of this empowers teams to deliver clear, data-driven narratives to stakeholders for confident decision-making.
Top board reporting features include:
Limelight’s pricing starts at $1,400 monthly, based on a subscription model. You can start with as few as five users and scale up with additional licenses as your organization grows.

Vena board reporting feature overview
Vena is a fully Excel-integrated FP&A platform that automates data consolidation and report distribution. It enables finance teams to deliver board-level financial packages while working within the familiar Excel environment.
Some key features include:

Cube board reporting tool overview
Cube is a cloud-based FP&A tool for financial reporting and analysis. It constructs multi-dimensional datasets and drill-through capabilities.
Its top features include:
Cube’s pricing varies for each company, based on features that fit their requirements. Contact Cube’s sales team for a customized quote.

Datarails board reporting tool overview
Datarails transforms traditional Excel workflows by integrating a robust database backend, specifically designed to elevate board reporting for finance teams. By centralizing data from multiple sources, Datarails empowers teams to deliver visually compelling, real-time reports that provide clear, context-rich narratives for board presentations.
Key board reporting features include:
Datarails does not provide specific pricing information on its website. Pricing is available upon request and is likely tailored based on the size of the business and the level of service required.

Workday Adaptive Planning board reporting tool overview
Workday Adaptive Planning delivers cohesive financial reporting, board packs, and interactive analytics in a cloud-native platform. It integrates with ERP and HCM systems, enabling finance teams to quickly build polished, drillable board materials.
Top board reporting features include:
Limelight’s reporting tools and ready-to-use templates help make every board meeting a success. Below are the core features you need to build reports that are detailed, insightful, and interactive.

Limelight dynamic dashboard overview
Interactive dashboards give CFOs a powerful "financial command center,” bringing together key reporting components like real-time KPIs, budget vs. actuals, cash flow, trend lines, and variance analytics into one intuitive, customizable interface.
They transform complex data into clear, actionable insights so board members can quickly grasp financial health and strategic opportunities without combing through dense reports.
Limelight generates board-ready reports including financial statements, P&Ls, variance explanations, and dynamic dashboards with visualizations. Users can create custom reports, dashboards, and ad-hoc queries all within a single platform. Finance teams can respond to board requests for specific metrics or insights in minutes, enhancing agility and reducing manual overhead.
Limelight integrates with ERP systems like Sage Intacct, NetSuite, and Microsoft Dynamics to provide real-time financial data for reporting.
With real‑time data updates, you always have the latest numbers before walking into a board meeting, eliminating spreadsheet churn.
With built-in drill-down capabilities, finance leaders can move from high-level summaries to transaction-level details instantly.
Click on a budget variance widget, for example, to uncover department-level drivers in seconds—adding depth to discussions and credibility to your analysis.
Limelight automates the scheduling and distribution of reports to key stakeholders, ensuring that board materials are delivered on time, every time. Automation reduces manual effort and keeps reporting cycles consistent and reliable.
Limelight’s AI-powered features help you analyze your financial data quickly and efficiently. The platform uses AI and automation to extract insights from your reports within minutes, enabling you to spot budgeting discrepancies, variances, and potential opportunities. This allows finance teams to make informed adjustments and proactively manage risks.
Collaboration features allow finance teams to annotate charts, add contextual comments, and share insights with stakeholders. Real-time collaboration improves clarity and accelerates decision-making during board prep and follow-ups.
Book your free personalized demo today.
Focus on what matters most to the board: financial health, performance trends, budget vs. actuals, forecasts, cash flow, and key business drivers. A strong board report also includes high-level insights, strategic risks, and clear visuals. Limelight helps streamline this by turning complex data into easy-to-understand dashboards and board-ready reports in minutes.
Many reports are overloaded with raw numbers, lack context, or don’t align with board-level priorities. This leads to confusion, more questions than answers, and decision-making delays. Tools like Limelight solve this by providing real-time data, customizable visuals, and collaborative tools that help CFOs focus on what really drives performance.
While monthly or quarterly is standard, dynamic businesses often need more frequent updates. With Limelight, you can automate report generation and pull live data at any time—allowing CFOs to provide real-time updates ahead of critical decisions without spending hours manually preparing decks.
Use clear, high-impact visuals—like variance charts, waterfall graphs, and KPI dashboards. Avoid spreadsheet overload. Limelight offers built-in, board-friendly visualizations that highlight key insights without overwhelming non-financial stakeholders.
Instead of chasing updates via email or version-tracking in Excel, modern CFOs use cloud-based tools like Limelight. It centralizes data, allows multiple contributors, tracks changes, and ensures accuracy—so everyone works from the same source of truth.
Subscribe to our newsletter