

%20(1).svg)
Net Income: What It Is and How to Calculate It
Key Takeaways
- Net income measures bottom-line profitability. It is the revenue and gains left after all recognized costs, expenses, interest, and income taxes are deducted.
- The calculation follows the income statement. Revenue flows through COGS, operating expenses, non-operating items, and taxes before reaching net income.
- One figure does not explain performance on its own. Gross profit, EBITDA, net profit margin, and cash flow help reveal where profitability changed and whether earnings converted into cash.
- FP&A teams should analyze the drivers behind the result. Revenue, pricing, volume, mix, direct costs, operating expenses, interest, taxes, and unusual items can each move net income.
- Limelight connects reporting, variance analysis, and forecasting. Finance teams can trace net-income changes and test their future impact in one FP&A workflow.
Net income is the profit or loss remaining after a company accounts for all recognized revenue, costs, expenses, interest, and income taxes for a reporting period. It answers a simple question: after everything included in the period has been counted, did the business make money or lose money?
The figure is straightforward to define but easier to misread. Revenue can grow while net income falls, and a profitable company can still face cash-flow pressure.
This guide explains how to calculate net income, identify the drivers behind it, compare it with other profitability measures, and use it in planning and forecasting.
What Is Net Income?
Net income is the amount a company earns after subtracting all recognized costs and expenses from its revenue and gains during a specific reporting period. When total costs and expenses exceed revenue and gains, the result is a net loss.
Net income appears near the bottom of the income statement, which is why it is often called the “bottom line.” An income statement may also be called a profit and loss statement, or P&L.
An SEC staff educational resource describes net income or loss as the amount remaining after all expenses are subtracted from revenue. In a multi-step income statement, those deductions can include cost of goods sold (COGS), operating expenses, depreciation and amortization, interest, taxes, and other non-operating items.
Net income also connects the primary financial statements. It increases retained earnings before dividends and other equity adjustments, and it is commonly the starting point for the operating-activities section of the cash flow statement under the indirect method.
How Is Net Income Calculated?
The exact presentation varies by company and industry, but the calculation follows the same logic: start with revenue and subtract every recognized cost and expense associated with the period.
Net income formula
A practical consolidated formula is:
Net income = Total revenue − COGS − operating expenses + other income − other expenses − income-tax expense
Depreciation and amortization may be included within COGS or operating expenses, depending on the function of the related assets. They should not be deducted again when those expense totals already include them.
How net income flows through the income statement
|
Income-statement stage |
Calculation |
What it indicates |
|
Gross profit |
Total revenue − COGS |
Profit remaining after direct production or service-delivery costs. |
|
Operating income |
Gross profit − operating expenses |
Profit generated after the costs of running the business. |
|
Income before tax |
Operating income + other income − other expenses |
Profit after financing and other non-operating items, but before income tax. |
|
Net income |
Income before tax − income-tax expense |
Final reported profit or loss for the period. |
Table: Net income is the final result of the income-statement flow after direct costs, operating expenses, non-operating items, and taxes are recognized.
The main components are:
- Total revenue: Income recognized from the company’s primary business activities.
- COGS: Direct costs associated with producing the goods or delivering the services sold.
- Operating expenses: Costs of running the business that are not included in COGS, such as selling, general, and administrative expenses and research and development costs.
- Other income and expenses: Non-operating items such as interest income, interest expense, and gains or losses from asset sales.
- Income-tax expense: The tax expense recognized for the reporting period.
Step-by-step net income example
The following hypothetical example uses Meridian Manufacturing Co., a mid-market industrial company.
|
Line item |
Calculation |
Amount |
|
Product sales |
$500,000 |
|
|
Service revenue |
$75,000 |
|
|
Total revenue |
$500,000 + $75,000 |
$575,000 |
|
COGS |
($230,000) |
|
|
Gross profit |
$575,000 − $230,000 |
$345,000 |
|
Selling, general, and administrative expenses |
($175,000) |
|
|
Depreciation and amortization |
($10,000) |
|
|
Operating income |
$345,000 − $175,000 − $10,000 |
$160,000 |
|
Interest expense |
($15,000) |
|
|
Income before tax |
$160,000 − $15,000 |
$145,000 |
|
Income-tax expense |
($65,000) |
|
|
Net income |
$145,000 − $65,000 |
$80,000 |
Table: Meridian Manufacturing converts $575,000 in revenue into $80,000 in net income after direct costs, operating expenses, interest, and taxes.
Common calculation errors
Even a simple formula can produce a misleading result when the inputs are incomplete or inconsistent. Check for the following errors before relying on the total:
- Double-counting depreciation and amortization: Confirm whether these expenses are already included in COGS or operating expenses.
- Skipping COGS: Subtracting only operating expenses overstates profit for companies with direct production or service-delivery costs.
- Confusing gross profit with net income: Gross profit excludes operating, financing, and tax costs.
- Ignoring non-operating items: Interest, gains, losses, and other non-operating entries can materially change the bottom line.
- Mixing reporting periods: Revenue and expenses must relate to the same accounting period.
- Treating unusual items as recurring: Restructuring charges, litigation settlements, impairments, and asset-sale gains can distort period-to-period comparisons.
What Does Net Income Tell You?
Net income confirms whether a company was profitable for the period, but effective financial statement analysis goes further by explaining what changed and why.
How to diagnose a change in net income
|
Driver |
Question to investigate |
Possible explanation |
|
Revenue |
Did sales volume, pricing, customer mix, or product mix change? |
Revenue may rise or fall even when unit economics remain stable. |
|
Gross margin |
Did material, labor, fulfillment, or service-delivery costs move? |
Direct-cost inflation can reduce profit despite revenue growth. |
|
Operating expenses |
Did headcount, marketing, technology, occupancy, or administrative spending change? |
Growth investments or weak cost control can pressure operating income. |
|
Interest and taxes |
Did borrowing costs, debt levels, or the effective tax rate change? |
Financing and tax effects can move net income without changing core operations. |
|
Unusual items |
Did an impairment, settlement, restructuring charge, or asset sale affect the period? |
A one-time item can make reported profit look stronger or weaker than the recurring run rate. |
Table: Net-income analysis should trace the bottom-line movement back to the specific revenue, cost, financing, tax, or unusual-item driver.
A structured budget variance analysis can compare actual results with the budget or forecast and isolate the line items responsible for the difference. The point is not merely to label a variance as favorable or unfavorable. Finance teams need to determine whether the cause is temporary, recurring, controllable, or likely to affect future periods.
Use the net profit margin to compare performance
Net profit margin expresses net income as a percentage of revenue:
Net profit margin = (Net income ÷ Total revenue) × 100
Meridian Manufacturing’s $80,000 in net income on $575,000 in revenue produces a net profit margin of approximately 13.9%. The same $80,000 in net income on $2 million in revenue would represent a 4% margin. The dollar result is identical, but the second business retains much less profit from each dollar of revenue.
Net profit margin is useful for comparing periods and similarly structured companies, but industry economics, accounting policies, capital intensity, and unusual items still affect the comparison.
What Can Distort Net Income?
Net income is a central earnings measure, but it does not provide a complete view of liquidity, operating quality, or the sustainability of performance. Review the following limitations before drawing conclusions.
- Accrual-accounting timing: Revenue and expenses are recognized when earned or incurred, which may not match the timing of cash receipts and payments.
- Non-cash expenses: Depreciation, amortization, impairments, and other entries can reduce earnings without creating an equivalent current-period cash outflow.
- Working-capital movements: Receivables, inventory, and payables can cause operating cash flow to move differently from net income.
- Accounting policies and estimates: Depreciation methods, inventory assumptions where permitted, reserves, useful lives, and impairment judgments can affect reported earnings.
- Unusual items: Restructuring charges, settlements, asset-sale gains, and other nonrecurring events can weaken period-to-period comparability.
- Limited operating detail: Net income does not identify which products, customers, entities, or departments created or reduced profit.
Before treating a net-income change as sustainable, ask whether cash flow moved in the same direction, whether the main drivers will recur, and whether an accounting estimate or one-time event materially affected the result.
Net Income vs. Gross Profit vs. EBITDA
Gross profit, EBITDA, and net income measure profitability at different points. None is universally “better.” The right measure depends on the decision being made.
For business analysis, “gross income” is often used to mean gross profit, although gross profit is the clearer financial-statement label.
Net income, gross profit, and EBITDA compared
|
Measure |
Basic calculation |
Best used for |
Main limitation |
|
Gross profit or gross income |
Revenue − COGS |
Evaluating pricing, production efficiency, service-delivery economics, and direct-cost control. |
Excludes operating expenses, financing costs, taxes, and other items. |
|
EBITDA |
Earnings before interest, taxes, depreciation, and amortization |
Supplementary operating comparisons and selected valuation or covenant analyses. |
Is not a cash-flow measure and can vary based on company-defined adjustments. |
|
Net income |
Revenue and gains − all recognized costs, expenses, and taxes |
Assessing complete reported profitability, earnings trends, retained earnings, and net profit margin. |
Can be affected by financing, tax, accounting estimates, and non-cash or unusual items. |
Table: Gross profit isolates direct economics, EBITDA removes selected financing, tax, and non-cash effects, and net income reports the complete bottom-line result.
Which measure should you use?
- Use gross profit when the question concerns pricing, product mix, production costs, or service-delivery economics.
- Use EBITDA when you need a supplementary operating view that reduces differences caused by financing, taxes, depreciation, and amortization.
- Use net income when you need the complete reported profit or loss after all recognized items.
- Review cash flow alongside all three when the decision depends on liquidity, debt capacity, or the company’s ability to fund operations and investment.
A company can have a strong gross profit and still report a net loss because operating expenses, interest, taxes, or unusual losses consume the remaining margin. It can also report positive net income while generating weak cash flow because earnings and cash follow different recognition rules.
How to Analyze and Forecast Net-Income Drivers
Historical net income explains the period that has ended. FP&A turns that result into a forward-looking decision tool by connecting each income-statement line to the operational assumptions that drive it.
Data quality is a practical constraint in that process. A forecast cannot explain future net income reliably when the actuals and operational inputs feeding it are inconsistent.
A five-step driver-analysis process
- Establish a trusted baseline. Reconcile the actual income statement and confirm that revenue, COGS, operating expenses, non-operating items, and taxes use consistent periods and account mappings.
- Identify the material variance. Compare actual net income with the budget, prior period, and latest forecast. Focus on the few line items that explain most of the movement.
- Connect the variance to business drivers. Use driver-based planning and budgeting to link changes in revenue and expenses to factors such as price, volume, headcount, wage rates, utilization, supplier costs, or interest rates.
- Update the forecast. Reflect recurring changes in the financial forecast instead of carrying forward assumptions that no longer match actual performance.
- Test decisions before committing. Use scenario planning to model how pricing changes, hiring plans, cost reductions, financing decisions, or demand shifts could affect future net income and cash flow.
The result should be a decision framework, not a longer variance report. Leadership needs to know what changed, whether it will continue, what management can influence, and how each available response affects the forecast.
When this work is spread across disconnected files, finance teams spend more time reconciling numbers than evaluating decisions. FP&A software can connect actual reporting, analysis, and forecasting in one controlled workflow.
How Limelight Supports Net-Income Analysis
Limelight helps FP&A teams move from identifying a bottom-line variance to understanding its cause and testing its future impact without rebuilding the analysis across separate spreadsheets.
1. Consolidate actuals into one reporting view
Limelight’s financial reporting software centralizes financial data from ERP and accounting systems and supports automated consolidations, income statements, budget-versus-actual reports, management reporting, and multi-entity consolidations. Finance teams can establish a consistent net-income baseline before investigating the drivers behind it.
2. Trace variances to underlying drivers
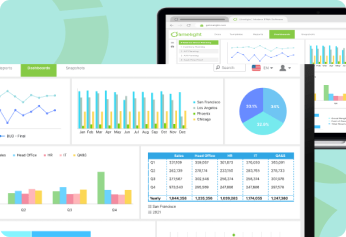
With interactive dashboards, teams can track financial metrics, compare budget with actual performance, apply filters, and drill into departments, entities, accounts, periods, and transactions. This helps determine whether a net-income variance originated in revenue, gross margin, operating expenses, or another line item.
3. Reforecast the impact of business changes
Limelight’s planning and forecasting capabilities support driver-based planning, rolling forecasts, variance analysis, and what-if scenarios. Teams can change assumptions such as sales volume, pricing, operating costs, or other key drivers and evaluate the effect on projected profitability before leadership commits resources.
See how Limelight connects reporting, analysis, and forecasting. Book a demo now!
Frequently Asked Questions
These answers address common questions that arise when net income is used for management reporting, planning, and decision-making.
1. Is net income the same as retained earnings?
No. Net income is the profit or loss for a specific reporting period. Retained earnings is the cumulative amount of earnings kept in the business after dividends and other equity adjustments. Periodic net income increases retained earnings, while a net loss reduces it.
2. Can revenue increase while net income decreases?
Yes. Revenue growth does not guarantee bottom-line growth. Net income can decline when COGS, operating expenses, interest, taxes, or unusual losses rise faster than revenue. A shift toward lower-margin products or customers can also increase sales while reducing profitability.
3. Should one-time gains and expenses be excluded from net-income analysis?
They should remain in reported net income when required by the applicable accounting framework. For internal analysis, finance teams may also present an adjusted view that separates material nonrecurring items. The adjustment should be clearly defined, consistently applied, and reconciled with reported net income.
4. Why can a profitable company have cash-flow problems?
Net income follows accrual-accounting rules, while cash flow reflects actual receipts and payments. Slow customer collections, inventory growth, capital expenditures, debt repayments, and other cash requirements can create pressure even when the income statement reports a profit.
5. How does net income affect budgeting and forecasting?
Net income is both an output and a diagnostic measure. Budgets and forecasts project the revenue, cost, financing, and tax assumptions that lead to expected net income. When actual results differ from the plan, FP&A teams trace the variance to its underlying drivers and update future assumptions accordingly.
Table of Contents
Ready to put an end to outdated FP&A?
Get a personalized demo