%20(1).svg)

By Limelight Team |
Last Updated: July 02, 2026

When you search 'AI forecasting software,' Google returns four entirely different categories of tools. Sales pipeline platforms like Clari and Gong. Supply chain demand planners like SAP IBP. Project resource trackers like Forecast App and Wrike. And FP&A financial planning platforms like Limelight, Anaplan, and Vena. They serve different buyers, solve different problems, and are built on entirely different data models.
This matters because the word 'AI' in each category refers to something structurally different. In sales forecasting, AI predicts deal close probability from CRM activity. In supply chain, AI optimizes inventory replenishment. In FP&A, AI replaces static Excel formulas with models that learn from your actual financial data, update in real time, and flag variances before they distort the plan.
To go deeper on AI financial forecasting for finance teams specifically, see our full guide.
|
Category |
Representative tools |
What the AI does |
|
Sales / RevOps |
Clari, Gong, Salesforce Einstein |
Predicts deal close probability from pipeline activity |
|
Supply chain |
SAP IBP, Blue Yonder |
Optimizes inventory replenishment and demand signals |
|
FP&A (this guide) |
Limelight, Anaplan, Vena, Planful |
Replaces static formulas with ML models on financial actuals |
|
Project / resource |
Forecast App, Wrike, Dart |
Predicts resource utilization and project timelines |
If you are a CFO or FP&A manager evaluating tools for budgeting, forecasting, and financial planning, you are in the right place. The rest of this guide covers FP&A AI forecasting only.
That said, not all finance teams are ready to extract value from AI forecasting on day one. The section below covers what AI actually does inside FP&A workflows, and what you need in place before the tools can work.
Traditional FP&A forecasting runs on static formulas: a finance analyst builds an Excel model, hard-codes assumptions about growth rates and cost ratios, and updates those cells manually each month when actuals come in. The model is only as accurate as the analyst's last update, and it cannot detect that your SaaS churn rate shifted three months before it shows up as a revenue miss.
AI forecasting changes that operating model at the architectural level. Instead of static formulas, the platform maintains machine learning models trained on your historical financial data. As actuals flow in from your ERP, the models recalibrate, surface anomalies, and regenerate projections without manual intervention. The analyst's job shifts from spreadsheet maintenance to interpretation and strategic response.
McKinsey's 2025 State of AI in Finance found that 44% of CFOs are using generative AI for five or more finance use cases, up from just 7% in 2024, which signals the shift from pilot to production.
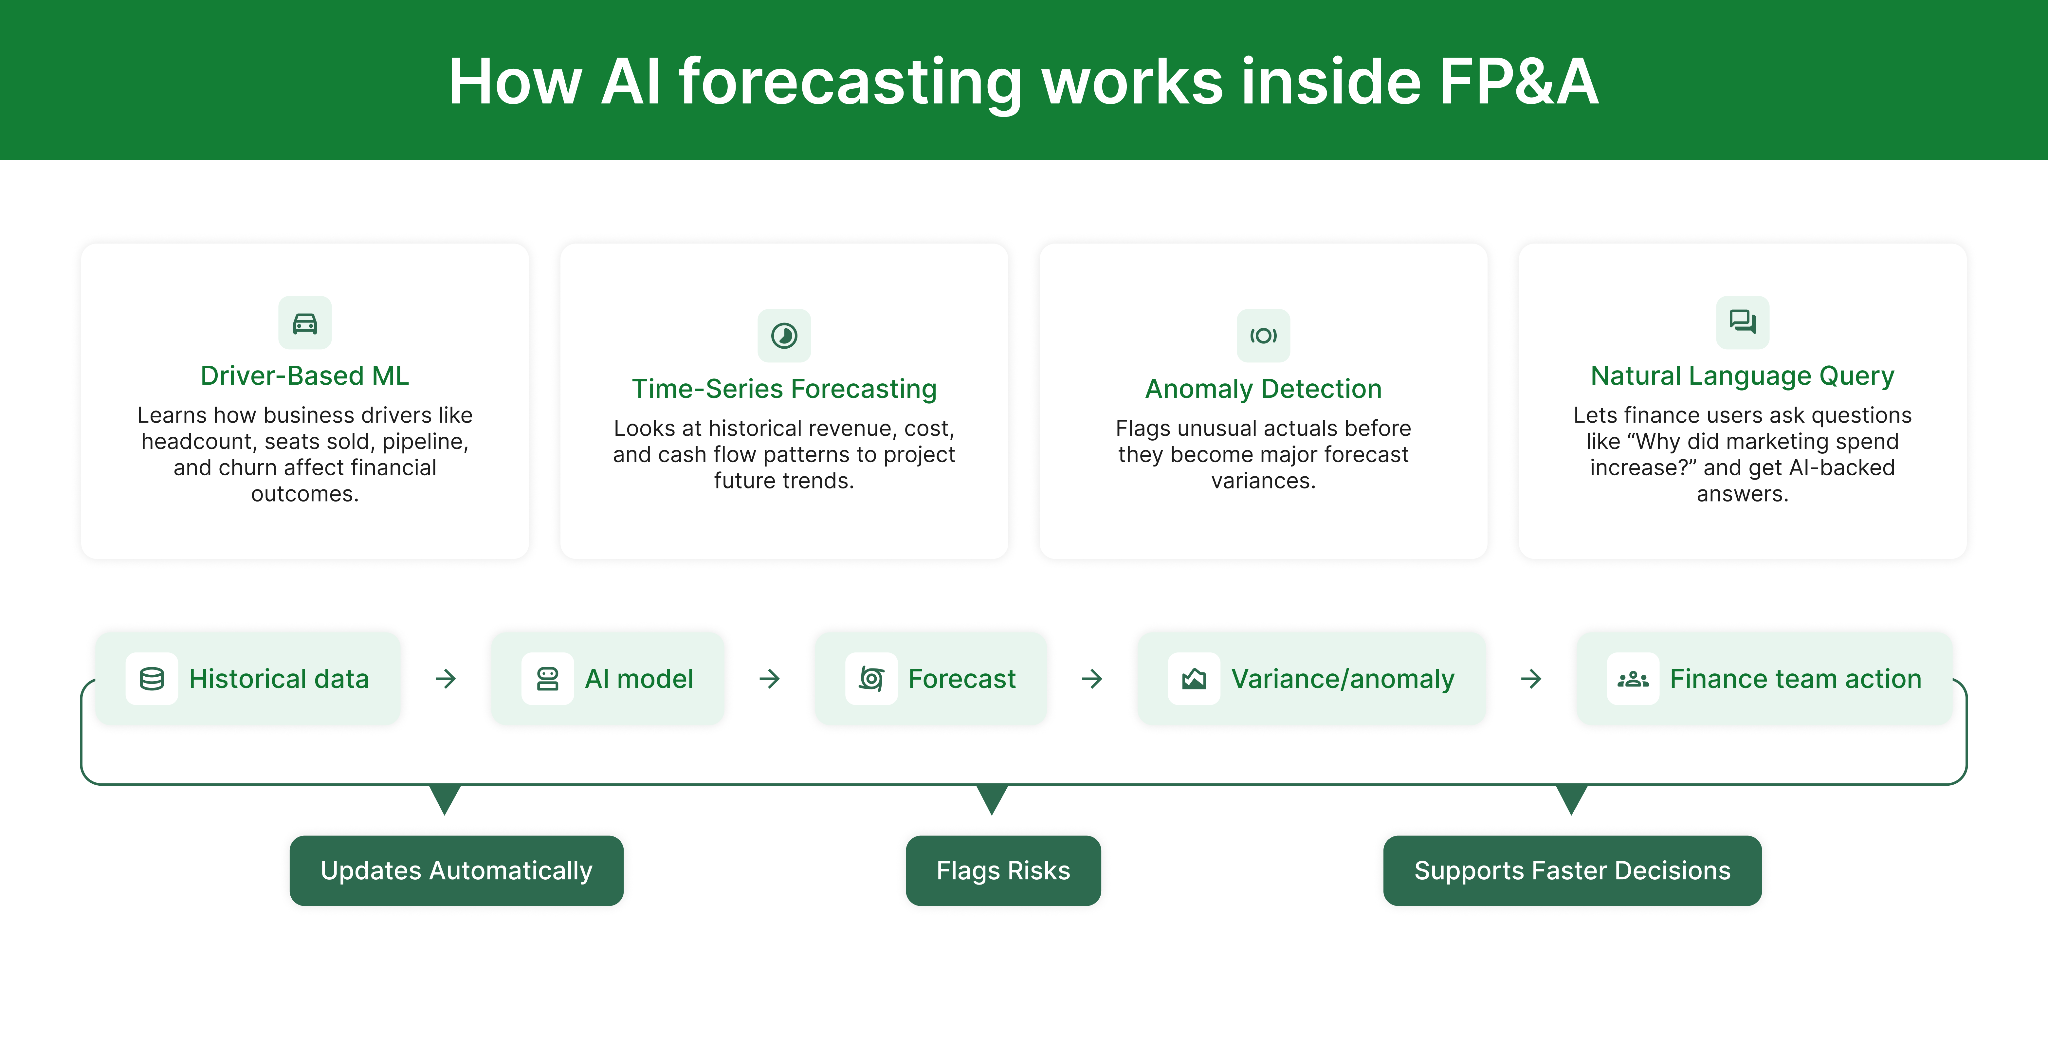
There are four AI mechanisms to understand when evaluating any FP&A platform:
|
IN PLAIN ENGLISH: the 4 AI mechanisms in FP&A forecasting
|
Explainability is the AI characteristic that determines whether the FP&A team can stand behind a forecast in a board meeting. An AI platform that produces projections without showing which drivers shaped them is a liability in finance, not a feature. FP&A is a trust function: the CFO presents numbers to the board, and investors make decisions based on those numbers.
Explainable AI in forecasting means the platform shows which drivers shaped each projection, whether revenue shifts came from churn, pipeline changes, or rising costs, and how actuals compare to model expectations at a line-item level. Teams can validate assumptions, override outputs they disagree with, and produce auditable trails for every board number.
According to CFO Shortlist's 2026 analysis of AI in finance: the best use of AI forecasting is not 'let the machine predict.' It is 'let the machine produce a baseline that forces the human to explain why they disagree.' That conversation is where forecast quality actually improves.
When evaluating any platform's AI capability, ask these questions before the demo ends:
The AFP Cash Forecasting Survey 2025 found that 59% of treasury teams cite data quality and availability as their primary forecast accuracy challenge, far exceeding technology limitations (18%) or process issues (23%). The implication is consistent across every research source: buying better forecast software without addressing data quality will not move the accuracy needle.
|
WATCH OUT: Common data readiness failures that break AI forecasting
|
With those structural requirements in mind, here is how the leading FP&A AI forecasting platforms handle cost, and what to expect from year-one total cost of ownership.
Most procurement conversations start with the subscription price and end there. That is the wrong stopping point. For FP&A AI platforms, year-one total cost of ownership is almost always 2 to 3x the quoted subscription price once three compounding cost layers are factored in.
Named vs. concurrent vs. read-only user pricing can shift annual cost dramatically. A 25-person FP&A team may only need 5 named licenses for active model builders, 10 for reviewers, and 10 read-only licenses for department heads. Vendors who price every user as a named license will quote 2 to 3x the cost of vendors with tiered seat structures. Always map your actual user types before comparing license quotes.
According to Glean's 2026 analysis of enterprise AI solution budgets, implementation adds 20 to 30% to baseline software cost in year one, with training adding $10,000 to $25,000 upfront. Platforms like Anaplan and Workday Adaptive Planning typically require 6 to 12 months of implementation, meaning you pay license fees for most of a year before seeing production value. Platforms like Limelight and Datarails target 2 to 12 weeks to go-live.
This is the least-discussed and most consequential cost layer. Some platforms charge for every AI model run, every scenario generation, or every NLQ query. Others include AI features in the base subscription at a flat rate. At 50 model runs per month, the difference between usage-based and flat-rate AI pricing can exceed $20,000 annually. Ask vendors this question before the demo ends.
With that cost structure in mind, here is how the 8 leading FP&A AI forecasting platforms compare.
The table below covers the 8 platforms most frequently evaluated by mid-market finance teams. Individual write-ups with pros, cons, G2 ratings, and pricing follow.
|
Tool |
Best for |
AI capability |
Pricing model |
Approx. Y1 all-in |
|
Limelight |
Mid-market: 500-5K employees on NetSuite / Intacct / Dynamics |
Forecast generator, AI-powered answers, anomaly detection. Explainable outputs with driver attribution. |
Starter Plan from $1,399/mo. AI included. No per-query fees. |
$19,999+ / yr |
|
Anaplan |
Fortune 500 with dedicated modeling resources |
PlanIQ + AI Forecaster and CoModeler agents. Deep scenario modeling. |
Custom. Entry $30K-$50K/yr. Enterprise $150K-$1M+. |
$500K-$2.5M+ |
|
Workday Adaptive |
Orgs already in Workday HCM / Financials ecosystem |
Illuminate predictive layer for rolling forecasts and HR-driven scenario modeling. |
$20-$40 / employee / yr standalone |
$60k - $240k |
|
Vena |
Excel-first teams in Microsoft 365 |
Vena Copilot: agentic NLP, anomaly detection inside Microsoft 365 environment. |
Custom. Est. $30K-$120K / yr |
$60K-$240K+ |
|
Planful |
Mid-market needing AI forecasting + consolidation |
Planful Predict: Signals (anomaly monitoring) + Projections (ML forecast suggestions). |
Custom. Est. $30K-$120K / yr |
$60K-$240K+ |
|
Datarails |
SMB to lower-mid-market with Excel continuity need |
FP&A Genius: chat-based queries, ML variance commentary, auto-consolidation. |
From ~$24K / yr. $400 / user / mo at base. |
$40k - $100k |
|
Pigment |
High-growth co. needing visual planning at speed |
Modeler Agent: NL model building, scenario AI, real-time recalculation at 500M+ cells. |
Custom. Est. Y1 TCO $300K-$600K |
$300K-$600K |
|
Jedox |
Mid-to-large orgs needing Excel + OLAP depth |
JedoxAI: planning workflow augmentation with explainable AI outputs for finance. |
Custom. Dual Excel + web interface. |
Custom |
Below, each tool is covered in detail with pros and cons and the specific finance team it fits best.
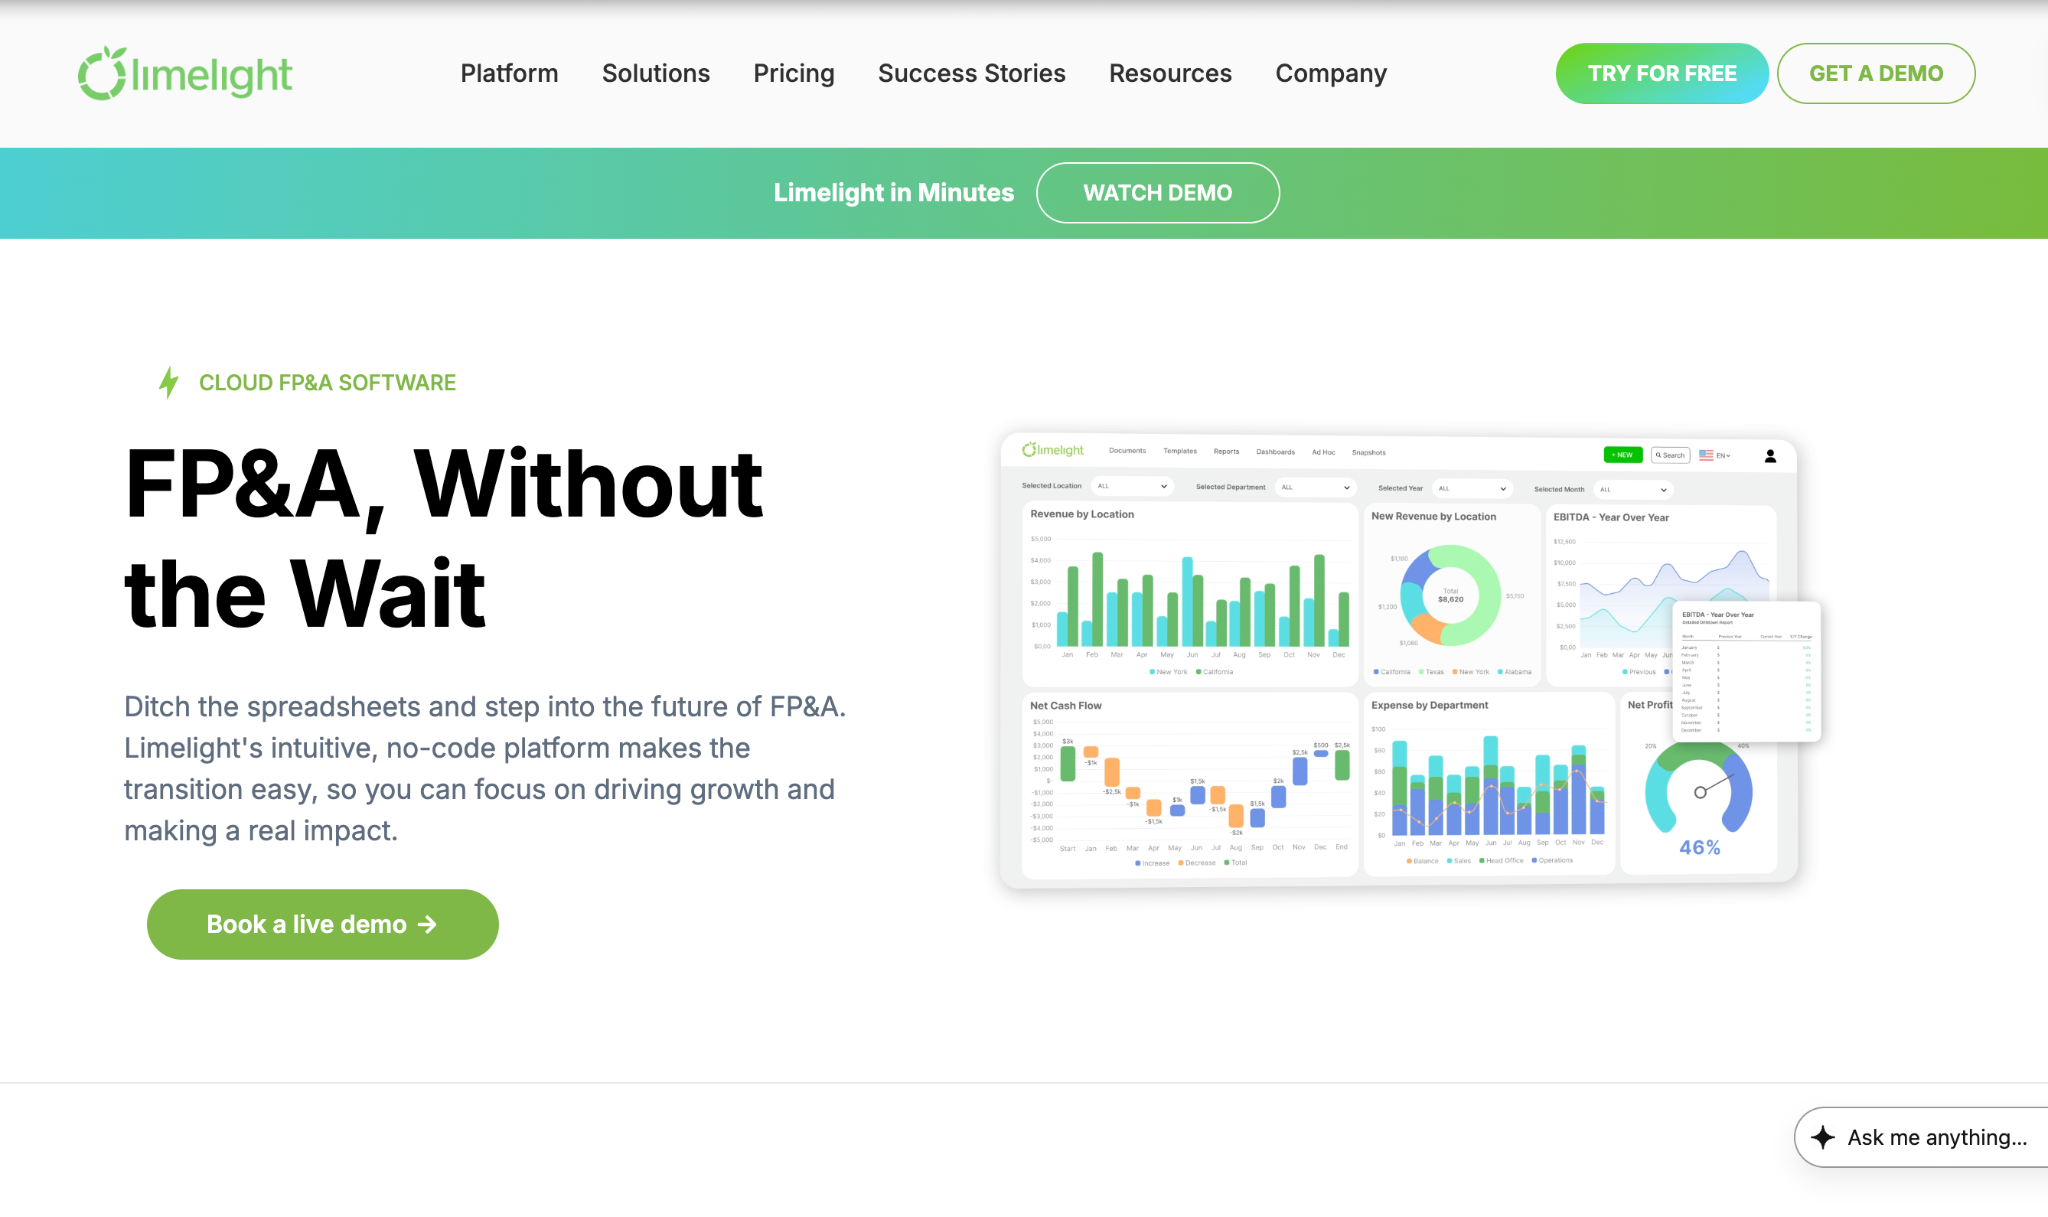
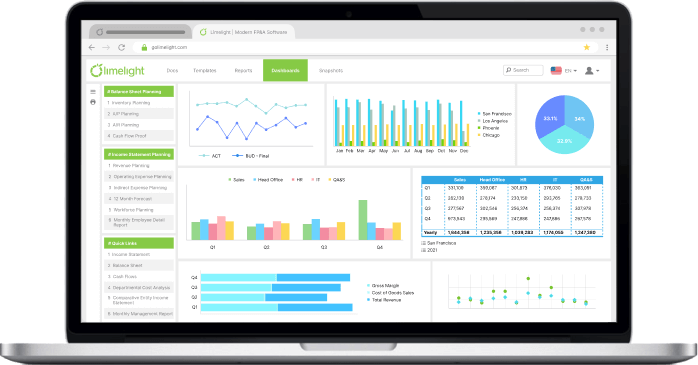
Limelight is the cloud FP&A platform built specifically for mid-market finance teams at companies with 500 to 5,000 employees running NetSuite, Sage Intacct, or Microsoft Dynamics. The platform is designed to feel like Excel while providing the robustness of a modern web application, and it deploys in weeks rather than quarters. Clients typically go live in 90 days; many achieve production deployment in 2 to 3 weeks.
Limelight AI is the platform's built-in AI forecasting engine, covering three core capabilities through its planning and forecasting capabilities: a forecast generator that produces ML-powered scenario variations from your live financial data, AI-powered answers that let finance users ask plain-English questions against actuals and get real-time explanations with driver attribution, and instant insight that generates automated variance commentary and anomaly flags. All three capabilities are included in the base subscription, with no per-query pricing and no usage-based overages that compound in year two.
Explore Limelight's interactive dashboards for real-time drill-down on those insights.
|
Strengths |
Limitations |
|
|
G2 Rating: 4.7/5
Pricing: Starts at $1,399/month. AI features included. No usage-based overages.
Best for: Finance teams at 500 to 5,000-employee US companies running NetSuite, Sage Intacct, or Dynamics who need AI forecasting live in weeks, not quarters, with predictable flat-rate pricing and no per-query AI fees.
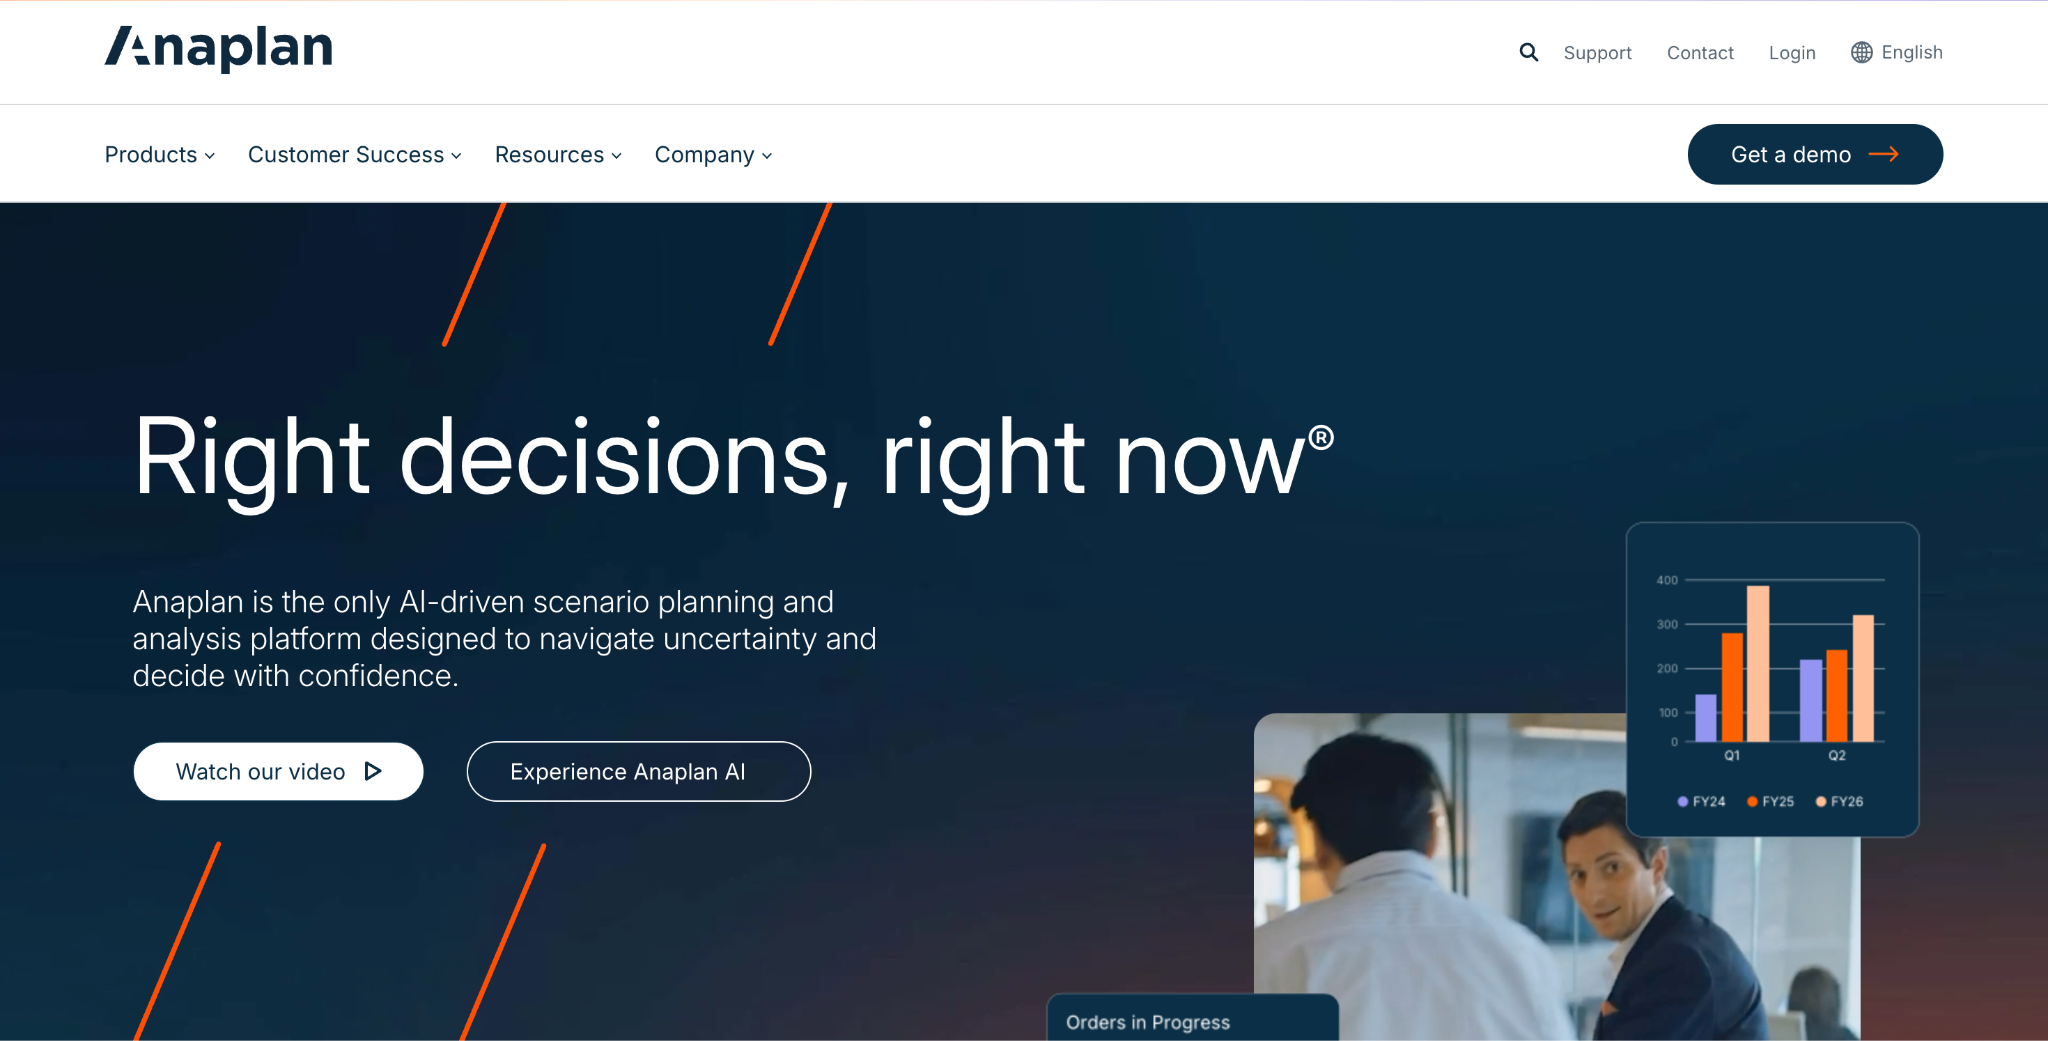
Anaplan is an enterprise connected planning platform. Its AI forecasting capability centers on PlanIQ, a machine learning layer for demand and financial forecasting, and a suite of role-based AI agents released in December 2025 including the Forecaster and CoModeler, which allow users to build and stress-test planning models through natural language commands.
Anaplan's connected planning architecture links finance, sales, supply chain, and HR data on a single platform, which is well-suited for large organizations running complex cross-functional plans.
The tradeoff is a cost and implementation profile that rarely makes sense below $150 million in revenue and almost never delivers value without a dedicated systems integrator engagement.
Year-one TCO for mid-market teams attempting an Anaplan deployment typically runs $500,000 to $2.5 million, per CFO Shortlist 2026.
|
Strengths |
Limitations |
|
|
G2 Rating: 4.6/5
Pricing: Entry $30K to $50K/yr. Typical enterprise $150K to $1M+/yr. Source: CFO Shortlist 2026. Year-one TCO with SI: $500K to $2.5M+ (CFO Shortlist, 2026).
Best for: Fortune 500 organizations with dedicated modeling resources, complex multi-entity plans spanning multiple business units, and multi-year implementation appetite.
Workday Adaptive Planning is the financial planning module within the Workday ecosystem. Its AI forecasting capability is delivered through Illuminate, a predictive layer that powers rolling forecasts, scenario modeling, and contextual guidance inside Adaptive's planning interface. For organizations already running Workday HCM or Workday Financials, the native integration eliminates the data pipeline effort that burdens every other platform.
For a detailed breakdown of costs, see our guide to Workday Adaptive Planning pricing.
The tradeoff is that Adaptive's value proposition weakens substantially for teams not already on Workday. The Illuminate AI layer is not available as a standalone module, and implementation typically equals 100 to 150% of the annual subscription in year one, per CheckThat.ai's 2026 pricing analysis.
Illuminate's particular strength is workforce-driven financial forecasting: headcount changes, attrition projections, and compensation modeling feed directly into financial forecasts without manual exports.
|
Strengths |
Limitations |
|
|
G2 Rating: 4.3/5
Pricing: $20 to $40 per employee per year standalone. Implementation typically equals 100 to 150% of annual subscription in year one (CheckThat.ai, 2026).
Best for: Mid-to-enterprise organizations already invested in the Workday HCM or Financials ecosystem who want to unify workforce and financial planning data without a secondary ERP integration.
Vena is the FP&A platform built around Excel. The core value proposition is that finance users never leave the spreadsheet interface, while the platform governs data integrity, enforces workflow controls, and provides a centralized audit trail behind familiar Excel cells.
Vena Copilot, the platform's AI layer, adds agentic NLP planning, natural language analysis, and anomaly detection within the Microsoft 365 environment. Vena Copilot is available inside Microsoft Teams, allowing business partners to ask financial questions without opening the FP&A platform directly.
For finance teams with deep Excel expertise and a Microsoft 365 investment, Vena offers a lower adoption barrier than any other platform in this comparison. Change management is simpler when the interface is already familiar.
The tradeoff is that the Excel-native architecture limits the depth of dimensional analysis and real-time recalculation available in purpose-built web platforms.
|
Strengths |
Limitations |
|
|
G2 Rating: 4.5/5
Pricing: Custom. Estimated $30K to $120K/yr (ronja.tech, 2026). Implementation typically lasts 2 to 5 months.
Best for: Microsoft 365 and Excel-first finance teams wanting to govern FP&A with AI augmentation without leaving the spreadsheet environment, particularly where business partner self-service via Teams is a priority.
Planful is the mid-market FP&A platform with the most mature standalone AI forecasting feature set in its segment, per ChatFin's 2026 FP&A software analysis.
Planful Predict consists of two components: Signals, which continuously monitors actuals and forecasts for anomalies and surfaces them before they compound into plan variances, and Projections, which generates AI-driven forecast suggestions based on historical patterns and current trend lines.
Planful's strength is the combination of AI forecasting with financial consolidation in a single platform, a capability that most mid-market teams would otherwise need two separate tools to achieve.
Planful's sweet spot is companies in the $100 million to $2 billion revenue range: sophisticated enough for multi-entity consolidation and rolling forecasts, but without the implementation complexity of Anaplan.
Multi-year contracts are typical, and buyers who present competitive alternatives in negotiation achieve 15 to 30% better pricing (Vendr, 2026).
|
Strengths |
Limitations |
|
|
G2 Rating: 4.3/5
Pricing: Custom. Estimated $30K to $120K/yr (ronja.tech, 2026). Multi-year contracts typically with 10 to 20% multi-year discount available.
Best for: Mid-market to enterprise finance teams in the $100M to $2B revenue range needing AI forecasting combined with financial consolidation in a single platform, without enterprise-scale implementation complexity.
Datarails is the Excel-native FP&A platform designed for SMB and lower-mid-market finance teams who want AI-powered data consolidation and variance commentary without migrating off Excel.
The platform consolidates data from 200+ sources automatically, and its FP&A Genius suite provides chat-based financial queries, ML-powered variance explanations in plain language, and automated insights and summaries that surface trends and anomalies without manual data slicing.
The entry price of approximately $24,000/yr makes Datarails accessible, but year-one total cost of ownership is typically 2 to 3x the base subscription once implementation ($10,000 to $50,000), user overages, and ERP connector fees are added (CheckThat.ai, 2026).
Teams that outgrow sub-200-employee complexity frequently find the platform's Excel-native architecture constraining for scenario modeling at mid-market scale.
|
Strengths |
Limitations |
|
|
G2 Rating: 4.6/5
Pricing: Starts at approximately $24,000/yr. Per-user approximately $400/mo at base tier (ITQlick, 2026). Year-one TCO typically 2 to 3x subscription (CheckThat.ai, 2026).
Best for: SMB to lower-mid-market finance teams wanting Excel continuity with automated data consolidation, chat-based financial queries, and AI-generated variance commentary at an accessible price point.
Pigment is the modern connected planning platform built for high-growth companies that need Anaplan-class cross-functional planning at a faster deployment pace. The platform's Modeler Agent allows users to build planning models from natural language commands, while AI-powered scenario exploration and real-time recalculation across 500 million-plus cells positions it as the closest mid-market alternative to Anaplan's technical depth.
Year-one total cost of ownership for mid-market teams typically runs $300,000 to $600,000, including software, implementation, and training, which is 40 to 50% lower than Anaplan's comparable tier (CFO Shortlist, 2026).
Implementation typically takes 2 to 4 months, substantially faster than Anaplan, though year-one cost still places Pigment outside the budget of most teams below $50 million in revenue.
|
Strengths |
Limitations |
|
|
G2 Rating: 4.6/5
Pricing: Custom. Mid-market Y1 TCO $300K to $600K including software, implementation, and training (CFO Shortlist, 2026). 40 to 50% lower than Anaplan Y1 equivalent.
Best for: High-growth companies needing modern visual connected planning with enterprise-scale AI scenario exploration at a faster deployment pace and lower cost than Anaplan.
Jedox is the planning platform for mid-to-large organizations that want Excel familiarity with sophisticated OLAP modeling underneath. The platform delivers a dual interface: an Excel add-in for finance users who prefer spreadsheet-based input, combined with a web interface for broader stakeholder access, powered by a multidimensional OLAP engine.
JedoxAI augments planning workflows with AI-generated analysis and recommendations, and its outputs are explicitly designed to be explainable for finance teams, which matters for board-level auditability.
Jedox occupies the space between Excel add-ons like Datarails and full enterprise EPM platforms like Anaplan.
For organizations with complex multidimensional modeling requirements and a globally distributed finance team that spans Excel users and web users, Jedox provides a distinctive architecture that few platforms match.
|
Strengths |
Limitations |
|
|
G2 Rating: 4.3/5
Pricing: Custom. Targets mid-to-large organizations globally. Implementation typically takes 3 to 6 months.
Best for: Mid-to-large organizations needing Excel familiarity combined with sophisticated OLAP modeling, explainable AI outputs, and a global, multi-entity deployment footprint.
The most common mistake in FP&A software evaluation is comparing list prices across platforms without accounting for the three cost layers covered earlier. The second most common mistake is evaluating AI features in isolation from the data readiness and ERP integration architecture that determines whether those features will have clean data to run on.
Follow this 6-step evaluation sequence before shortlisting any vendor:
Run an honest assessment of your chart of accounts consistency across business units, ERP data timeliness, and metric definition governance. The gaps you find predict your forecast accuracy ceiling more reliably than any vendor benchmark. Buying better forecast software without addressing data quality will not move the accuracy needle (AFP, 2025).
Map your current ERP, NetSuite, Sage Intacct, Dynamics, or SAP, to each vendor's native connector depth. A 'native integration' that runs on nightly exports is not the same as a bidirectional real-time connector. Ask vendors to show the live ERP connection in the demo, not a pre-loaded dataset.
Distinguish who in your organization needs to input data, who needs to review and approve, and who needs read-only visibility into reports. A 25-person team might need 5 named licenses, 10 reviewer licenses, and 10 read-only licenses. Run that math at each vendor's pricing structure before comparing totals.
A vendor can have excellent AI forecasting capability while burying usage-based charges that make it expensive at scale. Ask specifically: 'Is the AI feature flat-rate in my subscription, or is it priced per query, per model run, or per scenario generation?'
Ask every vendor: can your platform show which drivers produced each forecast number, at the line-item level? Can analysts override the AI projection and is that override tracked in an audit trail? AI that cannot be explained to the board is not production-ready for FP&A.
Take the subscription quote. Add 20 to 30% for implementation costs (Glean, 2026). Add ERP integration fees, training costs ($10,000 to $25,000 for most mid-market deployments), and estimated user overage costs. That number, not the subscription, is your actual year-one commitment. Require a reference customer at a company your size who went live within the timeline quoted.
For mid-market teams at 500 to 5,000 employees, the decision usually comes down to four questions:
Those four filters eliminate most of the shortlist. You can also compare these platforms against broader top CPM software options if your evaluation includes financial close and consolidation.
'AI forecasting software' covers four distinct buyer categories, and getting into the wrong product category wastes months of evaluation time. For FP&A buyers, the question is not whether AI is available on a platform, but whether the AI mechanism matches your workflow, the pricing model makes AI economically viable at your usage level, and the outputs are explainable enough that the CFO can stand behind them in a board meeting.
The 8 AI forecasting platforms in this comparison span a wide range of technical architectures, pricing models, and implementation timelines.
Before signing with any vendor, run the data readiness audit first. No AI forecasting platform will overcome a structurally inconsistent chart of accounts or stale ERP feeds. The teams getting real value from AI in finance are the ones with clean data, well-defined processes, and a clear understanding of which decisions need human judgment and which tasks can be accelerated.
For mid-market finance teams evaluating AI forecasting platforms, start with your data, then your ERP, map your seat types, build a year-one TCO model, and ask every vendor the same two closing questions: is the AI feature flat-rate or usage-based, and can I see which drivers produced that forecast number?
AI forecasting software uses machine learning to predict future outcomes from historical data. In FP&A, it replaces static Excel formulas with models that update automatically as actuals flow in, detect anomalies, and generate scenario variations. The term also covers sales pipeline tools and supply chain planners, which serve entirely different buyer needs.
For mid-market finance teams at 500 to 5,000 employees, strong options include Limelight (starts at $1,400/mo, AI included, deploys in weeks), Vena (Excel-native with Copilot AI in Microsoft 365), Planful (AI forecasting plus consolidation), and Datarails (Excel-native with FP&A Genius chat queries). The best fit depends on your ERP, team size, modeling complexity, and go-live timeline.
FP&A AI forecasting platforms range from $1,400/month (Limelight, flat-rate) to $100,000+/year at enterprise tiers (Anaplan, Workday Adaptive). Mid-market platforms like Vena and Planful run $30,000 to $120,000/year in licensing. Add 20 to 30% for implementation and year-one total cost typically reaches 2 to 3x the quoted subscription price.
Implementation timelines vary widely. Limelight typically deploys in 2 to 12 weeks. Vena and Planful take 2 to 5 months. Datarails targets 30 to 90 days for mid-market deployments. Anaplan and Workday Adaptive Planning typically require 6 to 12 months. Longer timelines mean paying license fees before seeing production value.
No. AI forecasting eliminates repetitive data collection and formula maintenance, freeing analysts for interpretation, scenario analysis, and strategic response. The analyst role becomes more strategic. Budget cycle time typically falls 30 to 40% when AI tools are integrated into planning (EagleRock CFO, 2026), while analyst capacity shifts to interpretation and business partnership.
Limelight, Datarails, Vena, and Workday Adaptive Planning all offer native or certified connectors for NetSuite and Sage Intacct. Dynamics integrations are common across most platforms. SAP integrations vary significantly in depth. Always confirm the integration is bidirectional and real-time, not a scheduled data export, before signing a contract.
Explainable AI means the platform shows which drivers produced each forecast number, not just the output itself. In FP&A, this matters because the CFO presents those numbers to the board. AI outputs that cannot be audited, attributed, or overridden are a liability in a trust function. Always ask vendors to demonstrate driver attribution and override controls before purchase.
At minimum: a consistent chart of accounts across business units, real-time or near-real-time ERP feeds, governed metric definitions that return the same value regardless of who queries them, and historical data depth of 2 to 3 years minimum (4 to 5 years for seasonal businesses). Data quality issues predict forecast accuracy ceiling more reliably than software selection.
Subscribe to our newsletter