%20(1).svg)
Financial Analysis Ratios: Types, Formulas, and Examples
By Aravind Swaminathan |
Last Updated: June 16, 2026
Finance teams spend hours pulling numbers from income statements, balance sheets, and cash flow reports. Without the right context, those numbers stay disconnected, making decisions harder than they should be. This is where many organizations struggle. Recent research shows that about 94% of business spreadsheets contain critical errors, increasing the risk of flawed analysis and missed signals.
Financial analysis ratios help cut through this noise. By turning raw financial data into comparable metrics, ratios allow teams to evaluate performance, spot trends, and understand financial health with more clarity. When applied correctly, financial analysis ratios support stronger planning, forecasting, and operational decisions.
In this guide, you’ll learn what financial analysis ratios are, how each category works, the formulas behind key ratios, and how finance teams apply them in real FP&A workflows.
Financial analysis ratios are calculations that compare two or more figures from a company’s financial statements to measure performance, financial health, and operational efficiency. Analysts, investors, and managers use these ratios to understand how effectively a business can meet debt obligations, generate profits, and use its resources. Because the outputs are standardized, financial analysis ratios allow performance to be evaluated without relying only on absolute dollar values.
These ratios are derived from three primary data sources. The balance sheet provides information on assets, liabilities, and equity, which supports liquidity and leverage analysis. The income statement supplies revenue, costs, and profit figures used in profitability and efficiency ratios. The cash flow statement shows how cash moves through the business and is essential for assessing liquidity and debt coverage from actual operating cash flows.
Financial ratios matter because they make comparison possible. Teams can compare companies of different sizes, track performance trends over multiple periods, and benchmark results against industry standards. This context supports more informed, data-driven decisions across planning, forecasting, and performance reviews.
It’s also helpful to distinguish between financial ratios and financial ratio analysis. Ratios are the individual metrics themselves, while ratio analysis is the process of interpreting those metrics together to draw meaningful conclusions.

Financial analysis ratios are typically grouped into five categories, each answering a different question about a company’s financial position and performance. Looking at these categories together helps finance teams move beyond surface-level metrics and build a more complete view of business health.
At a high level, liquidity ratios focus on short-term stability, profitability ratios explain earnings performance, efficiency ratios show how well resources are used, leverage ratios assess long-term risk, and market value ratios reflect investor expectations. These categories form the foundation of most ratio-based financial reviews used in FP&A, corporate finance, and investment analysis.
|
Category |
What it measures |
Key ratios (Examples) |
Primary users |
|
Liquidity |
Ability to meet short-term obligations |
Current ratio, quick ratio, cash ratio |
CFOs, FP&A teams, creditors |
|
Profitability |
Earnings relative to revenue, assets, or equity |
Gross margin, net margin, return on assets (ROA), return on equity (ROE) |
Executives, investors |
|
Efficiency |
How effectively assets generate revenue |
Asset turnover, inventory turnover |
FP&A, operations leaders |
|
Leverage |
Use of debt and long-term financial risk |
Debt-to-equity, interest coverage |
Lenders, finance leaders |
|
Market Value |
Stock valuation and investor perception |
P/E ratio, EPS, dividend yield |
Investors, analysts |
Liquidity ratios measure whether a company can cover near-term liabilities without financial strain. Profitability ratios focus on how much profit is generated from sales, assets, and invested capital. Efficiency ratios evaluate how well a business converts assets into revenue and manages working capital. Leverage ratios analyze the balance between debt and equity and a company’s ability to service long-term obligations. Market value ratios, mainly used by public companies, connect financial performance to stock price and shareholder returns.
In the sections that follow, each category is broken down into individual ratios with formulas, examples, and interpretation guidance.
Liquidity ratios measure a company’s ability to meet short-term obligations using assets that can be converted to cash within a year. These ratios are a core part of financial analysis ratios because they help finance teams evaluate whether day-to-day operations can continue without cash strain.
Creditors, lenders, and FP&A teams rely on liquidity ratios to assess risk, manage working capital, and plan for near-term funding needs.
Below are the most commonly used liquidity ratios.
Definition
The current ratio measures whether current assets are sufficient to cover current liabilities.
|
Formula |
Example
If a company has $600,000 in current assets and $300,000 in current liabilities, the current ratio is 2.0.
What it tells you
A higher ratio indicates stronger short-term financial flexibility. A low ratio may signal difficulty meeting obligations without external funding.
Benchmark range
1.5 to 3.0 is commonly viewed as healthy, depending on industry
Definition
The quick ratio measures short-term liquidity without relying on inventory.
|
Formula |
Example
With $600,000 in current assets, $200,000 in inventory, and $300,000 in current liabilities, the quick ratio equals 1.33.
Quick assets = $600,000 − $200,000 = $400,000
Quick ratio = $400,000 ÷ $300,000 = 1.33
What it tells you
This ratio focuses on assets that can be converted to cash quickly, making it useful when inventory is slow-moving or uncertain.
Benchmark range
1.0 or higher is often considered acceptable
Definition
The cash ratio measures the ability to pay current liabilities using only cash and cash equivalents.
|
Formula |
Example
If cash and equivalents total $150,000 and current liabilities are $300,000, the cash ratio is 0.5.
What it tells you
This is the most conservative liquidity measure and highlights immediate cash coverage.
Benchmark range
No universal benchmark; acceptable levels vary widely by industry, cash flow stability, and access to credit.
Definition
This ratio evaluates whether operating cash flow can cover short-term liabilities.
|
Formula |
Example
If operating cash flow is $360,000 and current liabilities are $300,000, the ratio is 1.2.
What it tells you
It links liquidity to actual cash generation rather than balance sheet snapshots.
Benchmark range
1.0 or higher suggests operating cash flows support obligations
Definition
Working capital represents the difference between current assets and current liabilities.
|
Formula |
Example
$600,000 − $300,000 = $300,000 in working capital
What it tells you
Positive working capital indicates a buffer for operations, while negative values may create funding pressure.
Benchmark range
Industry-specific; best evaluated over time
Liquidity ratios are most useful when reviewed together. Strong results in one ratio do not offset weaknesses in others, which is why ratios for financial analysis should always be interpreted in combination.
Profitability ratios measure how effectively a company generates earnings relative to revenue, assets, equity, and invested capital. These financial analysis ratios help finance teams understand whether growth translates into sustainable returns and how costs, pricing, and capital structure affect overall performance. Executives, investors, and FP&A teams rely on profitability ratios to evaluate margins, compare results across periods, and assess how efficiently capital is deployed.
Each ratio below follows a consistent structure to support clear interpretation and comparison.
Definition
Gross profit margin shows how much revenue remains after direct production costs.
|
Formula |
Example
If revenue is $1,000,000 and COGS is $600,000, gross profit margin is 40%.
What it tells you
This ratio reflects pricing discipline and cost control at the production level.
Benchmark Range
Varies by industry; service and software businesses often report higher margins
Definition
Operating profit margin measures earnings from core operations before interest and taxes.
|
Formula |
Example
Operating income of $200,000 on $1,000,000 in revenue results in a 20% margin.
What it tells you
It shows how efficiently a company manages operating expenses relative to sales.
Benchmark range
Industry-dependent; trends over time provide the most insight
Definition
Net profit margin measures the percentage of revenue that becomes net income.
|
Formula |
Example
$120,000 in net income on $1,000,000 in revenue equals a 12% margin.
What it tells you
This ratio reflects overall profitability after all expenses, taxes, and interest.
Benchmark range
Highly variable by sector and business model
Definition
ROA measures how efficiently a company uses its assets to generate profit.
|
Formula |
Example
$120,000 in net income and $2,000,000 in total assets yields an ROA of six percent.
What it tells you
Higher ROA indicates stronger asset utilization.
Benchmark range
Capital-intensive industries (manufacturing, utilities, infrastructure) typically report lower ROA (2%-10%) compared to asset-light sectors like software (15%-30%), due to substantial investments in property, plant, equipment, and infrastructure that increase the asset base relative to profit generation.
Definition
ROE measures returns generated on shareholders’ equity.
|
Formula |
Example
$120,000 in net income and $1,000,000 in equity equals a 12% ROE.
What it tells you
It shows how effectively equity capital is producing returns.
Benchmark range
Often compared against cost of equity, if ROE exceeds the cost of equity, the company generates returns sufficient to compensate shareholders for their risk and creates value; if ROE falls below cost of equity, returns are insufficient to meet investor expectations.
Definition
ROIC evaluates how effectively a company converts invested capital into operating profits, measuring the percentage return generated from both shareholder equity and debt-funded assets.
|
Formula |
Example
$150,000 in NOPAT and $1,500,000 average invested capital results in a 10% ROIC, meaning the company generates $0.10 in operating profit per dollar of invested capital.
What it tells you
ROIC reveals how efficiently management uses both equity and debt capital to generate operating profits. Higher ROIC indicates superior capital allocation and operational efficiency. By comparing ROIC to weighted average cost of capital (WACC), you assess whether capital is being deployed to create or destroy shareholder value.
Benchmark range
Profitability ratios provide the most insight when reviewed alongside liquidity and efficiency ratios, reinforcing why ratios for financial analysis should be evaluated together.
Efficiency ratios, also called activity ratios, measure how effectively a company uses its assets and manages day-to-day operations. These financial analysis ratios help FP&A teams understand how quickly resources such as inventory and receivables are converted into revenue or cash.
Strong efficiency ratios often indicate disciplined operations and tighter working capital management, while weaker results can signal process gaps or excess capital tied up in assets.
Below are the different types of efficiency ratios:
Definition
Asset turnover measures how efficiently a company converts its total asset base into revenue. It indicates how effectively management deploys capital and operational resources to generate sales.
|
Formula Where Average Total Assets = (Beginning Total Assets + Ending Total Assets) ÷ 2 |
Example
If net sales are $2,000,000 and average total assets are $1,000,000, the asset turnover ratio is 2.0, meaning the company generates $2 in revenue for every $1 in assets.
What it tells you
A higher asset turnover ratio indicates more efficient use of assets to generate sales. The ratio reveals whether the company is effectively utilizing its capital and resources, or if assets are sitting idle or underdeployed.
Benchmark range
Definition
Inventory turnover measures how many times a company sells and replaces its entire inventory during a period. It indicates how quickly inventory moves through the business.
|
Formula Where Average Inventory = (Beginning Inventory + Ending Inventory) ÷ 2 |
Example
If COGS is $900,000 and average inventory is $150,000, inventory turnover equals 6.0x, meaning the company sold and replaced its entire inventory 6 times during the period (approximately every 61 days: 365 ÷ 6).
What it tells you
Higher turnover indicates inventory moves quickly through the business, suggesting efficient inventory management and strong demand. Lower turnover may indicate overstocking, slow-moving products, or weak demand. However, excessively high turnover can signal insufficient stock levels leading to stockouts. The optimal balance depends on industry and business model.
Benchmark range
Industry-specific; best assessed against peers. Compare year-over-year trends within your company to identify improving or declining efficiency, rather than targeting a single benchmark number.
Definition
DSI measures the average number of days inventory remains unsold before being sold. It indicates how long capital is tied up in inventory. (Also known as Days Inventory Outstanding or DIO.)
|
Formula |
Example
With an inventory turnover of 6.0x, DSI = 365 ÷ 6 = approximately 61 days. This means inventory sits for an average of 61 days before being sold.
What it tells you
Lower DSI indicates inventory moves faster and capital is freed up more quickly. Higher DSI means capital is tied up longer in inventory, which increases carrying costs and working capital requirements. However, very low DSI (under 10-15 days) may indicate stockout risk and insufficient inventory to meet demand.
Benchmark range
Highly dependent on product type and supply chain model. Compare against your industry peers and track year-over-year trends. DSI is a key component of working capital management and directly impacts cash flow.
Definition
This ratio measures how efficiently a company collects cash from its credit sales. It shows how many times, on average, receivables are converted to cash during a period.
|
Formula Where Net credit sales = credit sales minus returns/allowances and Average accounts receivable = (Beginning AR + Ending AR) ÷ 2 for the period |
Example
$1,800,000 in net credit sales and $300,000 in average AR yields a turnover of 6.
What it tells you
A higher ratio generally indicates:
Very high turnover can sometimes signal overly tight credit terms.
Benchmark range
Best interpreted relative to the company’s stated credit terms and peer averages within the same industry.
Definition
DSO measures the average number of days required to collect receivables.
|
Formula |
Example
A turnover of six results in a DSO of roughly 61 days.
What it tells you
Lower DSO supports stronger cash flow and liquidity.
Benchmark range
Target: DSO should approximate or be lower than stated payment terms (e.g., net 30 terms → target DSO ≤ 30 days):
Efficiency ratios complement liquidity and profitability measures by showing how operational decisions affect cash flow and returns. This reinforces why financial ratios should always be reviewed together.
Leverage ratios assess how a company finances its operations and growth through debt compared to equity and earnings. These financial analysis ratios help finance teams understand long-term financial risk, capital structure balance, and the ability to meet ongoing debt obligations.
Lenders, investors, and CFOs rely on leverage ratios to evaluate solvency, borrowing capacity, and exposure to interest rate or cash flow pressure.
Unlike liquidity ratios, which focus on the short term, leverage ratios look at sustainability over multiple years. High leverage can amplify returns during growth periods but increases financial risk during downturns, making careful interpretation essential.
Definition
The debt-to-equity ratio compares total liabilities to shareholders’ equity.
|
Formula |
Example
If total liabilities are $1,200,000 and equity is $800,000, the ratio is 1.5.
What it tells you
Higher ratios indicate greater reliance on debt financing.
Benchmark range
Industry-dependent; a ratio of 1.0 or below is generally considered conservative across most sectors. However, capital-intensive industries (utilities, manufacturing, real estate, energy) typically operate with ratios between 2.0–3.0, while technology and consumer discretionary sectors average 0.4–0.9.
Definition
The debt ratio measures the portion of assets financed through debt.
|
Formula |
Example
$1,200,000 in liabilities and $2,000,000 in assets results in a ratio of 0.6.
What it tells you
It shows how much of the company is funded by creditors rather than owners.
Benchmark range
Lower ratios suggest lower financial risk
Definition
This ratio evaluates the ability to pay interest using operating income.
|
Formula |
Example
EBIT of $300,000 and interest expense of $75,000 yields a ratio of 4.
What it tells you
Higher coverage indicates stronger capacity to service debt.
Benchmark range
Definition
DSCR measures the ability to cover total debt payments from net operating income (NOI). It compares the cash flow available for debt repayment against all debt service obligations, including principal, interest, and lease payments.
|
Formula Where Total Debt Service = Principal Repayment + Interest Payments + Lease Payments |
Example
$360,000 in net operating income and $300,000 in debt service equals 1.2.
What it tells you
Values above 1.0 indicate cash flow covers debt obligations. A ratio of 1.2 means the property generates 20% more cash flow than needed to cover annual debt service.
Benchmark range
Most commercial lenders require a minimum DSCR of 1.25x. A DSCR of 1.20x is the absolute minimum acceptance threshold, while 1.25x or higher is considered standard across conventional lenders. In commercial real estate, 1.25x indicates that net operating income is 25% greater than annual debt service, providing lenders with an adequate buffer.
Market value ratios connect a company’s financial performance to how it is valued by investors. These financial analysis ratios are primarily used for publicly traded companies, where share price data is available. Analysts and investors rely on market value ratios to assess growth expectations, earnings quality, and how the market prices risk and future returns.
While liquidity, efficiency, and leverage ratios focus on internal performance, market value ratios reflect external sentiment. They help explain how financial results translate into shareholder value and how a company compares to peers in the same industry.
Definition
The P/E ratio compares a company’s share price to its earnings per share.
|
Formula |
Example
If a stock trades at $40 and EPS is $4, the P/E ratio is 10.
What it tells you
Higher P/E ratios often reflect stronger growth expectations and investor optimism about future earnings potential. Conversely, a high P/E ratio may also indicate overvaluation if growth expectations are not met. Lower P/E ratios may suggest undervaluation or lower growth prospects.
Benchmark range
Highly industry-dependent and best compared against peers. General thresholds include:
Definition
EPS measures the portion of profit allocated to each outstanding share.
|
Formula |
Example
$1,000,000 in net income and 500,000 shares results in $2 EPS.
What it tells you
Higher EPS indicates stronger profitability on a per-share basis.
Benchmark range
Compared over time and against competitors
Definition
The P/B ratio compares a company's market value to the book value of its equity, revealing what investors are willing to pay for each dollar of assets.
|
Formula |
Example
A $30 share price and $15 book value yields a P/B of 2.0.
What it tells you
Benchmark range
Highly dependent on industry composition and asset base.
Definition
Dividend yield shows the annual dividend relative to share price.
|
Formula |
Example
A $2 dividend on a $40 stock equals a five percent yield.
What it tells you
It reflects income return from holding the stock.
Benchmark range
Varies based on sector and growth strategy
Market value ratios complete the picture by showing how financial results are perceived externally. For meaningful insight, these ratios should be reviewed alongside profitability, leverage, and liquidity ratios rather than on their own.
Financial ratios become useful only when they are interpreted in context. Looking at a single number in isolation rarely explains what is actually happening in a business. The methods below show how finance teams use ratios for financial analysis in a more structured, decision-oriented way.
Trend analysis compares the same financial ratios over multiple periods, usually three to five years. This approach helps identify patterns, direction, and momentum rather than focusing on a single point in time. For example, a steadily declining liquidity ratio may signal growing working capital pressure, even if the current value still appears acceptable. Context is critical.
Changes in ratios should always be reviewed alongside business events such as acquisitions, pricing changes, cost restructuring, or shifts in revenue mix.
Industry benchmarking compares a company’s financial ratios against industry averages to understand relative performance. Sources such as RMA Annual Statement Studies and Dun & Bradstreet publish benchmark ranges by sector and company size. This matters because healthy ratio ranges vary widely across industries. A debt level that is common in utilities may be risky for a professional services firm. Benchmarking helps teams avoid applying the wrong standards.
Cross-sectional analysis compares ratios against direct competitors or a defined peer group. This method highlights competitive strengths and weaknesses, such as cost efficiency or capital structure differences. Peer averages often provide more relevant insight than broad industry benchmarks.
Financial ratios rely on historical data and do not predict future outcomes. Differences in accounting methods can affect comparability, and seasonal fluctuations may distort results. Most importantly, no single ratio tells the complete story. Ratios should always be reviewed together.

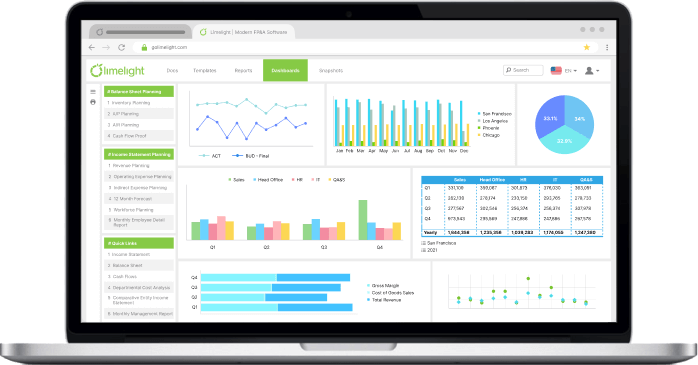
Financial ratio analysis often breaks down at the execution level. Data lives across ERPs and spreadsheets, formulas require constant maintenance, and tracking trends over time becomes manual and error-prone. Limelight addresses these challenges by embedding ratio analysis directly into everyday FP&A workflows.
With real-time ratio dashboards, key financial ratios update automatically as new data flows in from connected ERP systems. This removes delays caused by manual data refreshes and keeps teams working from a consistent source of truth. Automated calculations replace complex spreadsheet formulas, reducing the risk of errors and freeing up time previously spent on validation and reconciliation.
Limelight also simplifies trend tracking. Built-in variance analysis allows finance teams to monitor how liquidity ratios, efficiency ratios, and leverage ratios change over time, helping explain what moved and why. Because the interface is designed to feel familiar, many teams describe it as a “supercharged pivot table” experience, which shortens adoption time and reduces dependency on technical support.
Limelight AI adds another layer by highlighting anomalies and explaining variances automatically, supporting faster insight without additional analysis work. Customers report 75% faster budgeting and forecasting, allowing more focus on interpretation and decision-making.
See how Limelight can automate your financial analysis. Request a demo.
Financial ratios are individual calculations, such as the current ratio or return on equity, derived from financial statements. Financial ratio analysis is the broader process of interpreting those ratios together, across time or against benchmarks, to assess performance, risk, and financial health in a meaningful way.
For small businesses, liquidity ratios like the current ratio and cash ratio are often the most critical because they reflect short-term cash stability. Profitability ratios, such as net profit margin, also matter for sustainability. The right mix depends on the business model, industry, and stage of growth.
Most companies calculate financial ratios monthly or quarterly as part of regular reporting cycles. High-growth or cash-sensitive organizations may review key ratios more frequently. The goal is consistency. Tracking ratios at the same intervals allows teams to spot trends early and respond before issues escalate.
A current ratio between 1.5 and 3.0 is commonly viewed as healthy, but this varies by industry. Asset-heavy or inventory-driven businesses may operate comfortably with different ranges. Rather than relying on a single target, it’s more useful to compare the ratio over time and against peers. Additionally, monitor whether high ratios result from efficient asset management or excess cash/slow-moving inventory that's not being productively deployed.
Financial ratios can signal financial distress but do not predict bankruptcy on their own. Declining liquidity ratios, weak interest coverage, or rising leverage may indicate risk. However, ratios rely on historical data and should be combined with cash flow analysis and qualitative business factors.
Financial ratio analysis has several limitations. Ratios are based on past data and may not reflect future conditions. Differences in accounting methods reduce comparability, and seasonal effects can distort results. Most importantly, no single ratio explains the full financial picture without supporting context.
In Excel, financial ratios are calculated using manual formulas and linked data, which requires frequent updates and validation. FP&A software like Limelight automates calculations by pulling real-time data from source systems, tracking trends over time, and reducing formula errors, making ratio analysis more consistent and scalable.
Subscribe to our newsletter