%20(1).svg)

By Michael A. Corcoran |
Last Updated: March 26, 2026

Revenue is the lifeblood of every SaaS business. But without tracking the right SaaS financial metrics, you miss out on significant revenue opportunities.
For SaaS CFOs and FP&A teams, the consequences are clear: overspending, suboptimal pricing, poor resource allocation, and missed upselling opportunities. Without visibility into key numbers, decision-making becomes reactive rather than strategic, limiting both growth and profitability.
In this blog, we break down 15 essential SaaS financial metrics that every finance team should monitor. You'll also discover the top tools to help you track them effectively and make smarter, faster decisions.
SaaS financial metrics are key performance indicators (KPIs) that measure the financial health and growth of SaaS businesses. These metrics provide visibility into revenue trends, customer behavior, and overall business efficiency.
Common examples include:
SaaS financial metrics provide actionable insights into a company’s financial health, customer behavior, and operational efficiency. These metrics highlight inefficiencies (e.g., high CAC or churn), uncover opportunities (e.g., upselling to increase CLV), and boost financial predictability (via MRR/ARR).
For instance, reducing churn by 5% can double profitability over time, while optimizing CAC and CLV can unlock funds for innovation or market entry. Tracking these metrics enables SaaS companies to align operations with customer needs, build more accurate revenue forecasts, and maximize cash flow. It also attracts investors and prepares your company for exponential growth.
Here are 15 key SaaS metrics you must track for optimized revenue and financial health.
Acquisition metrics measure how effectively a SaaS company attracts new customers and manages related costs. They help evaluate the efficiency of marketing and sales efforts, optimize budgets, and support sustainable growth.
CAC represents the total expenses incurred to acquire a new customer, including marketing and sales expenditures. Understanding CAC helps SaaS companies assess the profitability of their growth strategies and allocate resources efficiently.
Formula
CAC = Total Sales & Marketing Costs ÷ Number of New Customers Acquired
Benchmark range
According to the First Page Sage B2B SaaS Customer Acquisition Cost: 2026 Report:
Let’s say your SaaS firm spends $300,000 on marketing and sales to acquire 500 new customers in a quarter.
CAC = $300,000/500 = $600
This metric indicates how long it takes for a SaaS company to recover the cost of acquiring a new customer. A shorter payback period means faster ROI and better capital efficiency.
Formula
CAC Payback Period (months) = CAC ÷ (Average Revenue Per Account × Gross Margin %)
Benchmark range
According to the SaaS CAC Payback Benchmarks: 2026 Report:
Example:
If your SaaS firm has a CAC of $120, an Average Revenue Per Account (ARPA) of $10/month, and a gross margin of 70%:
CAC Payback Period: $120 ÷ ($10 × 0.7) = ~17 months
Growth metrics provide insights into a company's revenue performance, customer acquisition efficiency, and overall business health. FP&A teams use these for forecasting, budgeting, and investment decision-making.
Monthly recurring revenue (MRR) measures the normalized monthly subscription revenue a SaaS business can reliably anticipate. It standardizes income by removing billing cycle variability, helping finance teams forecast cash flow, plan hiring, and guide marketing spend.
Formula
MRR = Sum of all monthly subscription revenue from paying customers
Benchmark range
As per ChartMogul’s 2023 SaaS growth report:
Example
A SaaS company offers three pricing tiers: $50/month, $100/month, and $500/month. With 100 customers on the $50 tier, 50 on the $100 tier, and 10 on the $500 tier:
MRR = (100 × $50) + (50 × $100) + (10 × $500) = $5,000 + $5,000 + $5,000 = $15,000
Annual recurring revenue (ARR) represents the expected yearly recurring revenue, assuming the customer base remains stable. It’s a core metric for long-term financial planning, company valuation, and investor reporting.
Formula
ARR = MRR × 12
Or
ARR = Total contract value ÷ Contract length (in years)
Benchmark range
Example
If a customer signs a four-year, $20 million contract:
ARR = $20 million ÷ 4 = $5 million
The Rule of 40 states that a healthy SaaS company's combined growth rate and profit margin should equal or exceed 40%. This metric ensures a balanced focus on both growth and profitability, preventing companies from over-prioritizing one at the cost of the other.
Formula
Rule of 40 = Revenue Growth Rate (%) + Profit Margin (%)
Benchmark range
According to the 2024 KeyBanc Capital Markets & Sapphire Ventures SaaS Survey:
Example
A SaaS company with a 30% annual revenue growth rate and a 15% profit margin would have a Rule of 40 score of 45% (30% + 15%), indicating healthy performance.
Economic metrics evaluate a company’s profitability, efficiency, and financial sustainability. These metrics are vital for optimizing pricing strategies, managing costs, and assessing profitability.
CLTV estimates the total revenue a business can expect from a single customer over their lifetime. It helps determine how much to invest in customer acquisition and retention while maintaining profitability.
Formula
CLTV = (ARPA × Gross Margin %) ÷ Customer Churn Rate
Benchmark range
Since a 3:1 CLTV:CAC ratio is considered ideal, healthy SaaS companies typically aim for a CLTV that is 3–4× CAC.
Example
A SaaS tool with a $100/month ARPA, 80% gross margin, and 2% monthly churn would have a CLTV of ($100 × 0.8) ÷ 0.02 = $4,000
This ratio compares the lifetime value of a customer to the cost of acquiring them. It measures sales and marketing efficiency and ensures growth doesn’t come at unsustainable costs.
Formula
CLTV: CAC = Customer Lifetime Value ÷ Customer Acquisition Cost
Benchmark range
According to Benchmarkit's 2024 B2B SaaS Performance Metrics Benchmark Report, 3.6 was the median ratio for the fiscal year 2023.
According to the First Page Sage data based on the past five years’ trend:
Example
If a company spends $50,000 on marketing to acquire 100 customers (CAC = $500) and their CLTV is $1,500, then:
CLTV:CAC ratio is 3:1
Gross margin measures profitability after deducting direct costs (e.g., hosting, support). It reflects scalability and operational efficiency with recurring revenue.
Formula
Gross Margin (%) = [(Revenue − Cost of Goods Sold) ÷ Revenue] × 100
Benchmark range
Example
A company with $1M revenue and $200K in COGS (Cost of Goods Sold) has an 80% gross margin. If cloud costs spike and margins drop to 65%, it may be time to renegotiate vendor contracts or optimize server usage.
Burn rate calculates how quickly a company spends its available cash before reaching profitability. It’s essential for managing the runway and preventing liquidity crises.
Formula
Gross Burn Rate = Total Monthly Cash Expenses
Net Burn Rate = Gross Burn − Monthly Revenue
Benchmark range
SaaS companies with $10 million-$50 million year-end ARR have 25 months of cash runway. While companies with less than $10 million as well as greater than $50 million year-end ARR have an 18-month runway.
Example
A startup with $2M in cash reserves and a $150K net monthly burn would have approximately 13 months of runway.
Retention metrics measure how effectively a SaaS company keeps its customers and revenue over time. High retention rates signal product-market fit and customer satisfaction.
Churn rate is the percentage of customers or revenue lost over a specific period, typically monthly or annually. A high churn can quickly erode recurring revenue and undermine growth efforts.
Formula
Benchmark range
According to ChartMogul's SaaS Benchmarks report, best-in-class companies have churn rates as follows:
Net MRR churn rate:
Customer churn rate
Example
If a SaaS company starts the month with 1,000 customers and loses 20, the monthly customer churn rate is:
(20 ÷ 1,000) × 100 = 2%
NRR measures the percentage of recurring revenue retained from existing customers over a period, factoring in expansions, contractions, and churn. It indicates product value and growth potential by showing whether upsells and renewals outweigh lost revenue.
Formula
NRR = [(Starting MRR + Expansion MRR – Churned MRR – Contraction MRR) ÷ Starting MRR] × 100
Benchmark range
Example
A company starts the quarter with $100,000 MRR, adds $15,000 from upsells, loses $5,000 to churn, and sees $2,000 in downgrades.
NRR = ($100,000 + $15,000 – $5,000 – $2,000) ÷ $100,000 × 100 = 108%
Customer engagement score quantifies how actively and deeply customers use a product, often combining metrics like logins, feature adoption, and support interactions.
Formula
There’s no universal formula; companies typically assign weighted values to key usage metrics (e.g., logins, feature use, support tickets resolved) to create a composite score.
Benchmark range
According to Salesforce:
Example
Suppose your company tracks weekly logins, dashboard views, and report downloads to measure engagement. Customers with a score above 80 are flagged as “power users,” while those scoring below 40 trigger proactive outreach from the customer success team.
Revenue metrics provide a clear view of how much money a SaaS company generates from its customers, both on a per-user basis and through contracted sales. These metrics help understand revenue quality, forecast growth, and make decisions about pricing or customer segmentation.
Average Revenue Per User (ARPU) measures the average monthly or annual revenue generated from each active customer or account. It helps assess pricing effectiveness, customer value, and the impact of upsell or cross-sell strategies.
Formula
ARPU = Total Revenue in Period ÷ Number of Active Users in Period
Benchmark range
There's no single "good" ARPU benchmark for SaaS companies, as it varies widely based on industry, pricing model, market segment, and location.
Example
If a SaaS company earns $200,000 in monthly recurring revenue from 500 customers, its ARPU is $200,000 ÷ 500 = $400
Bookings represent the total value of all new contracts signed within a period, regardless of when revenue is recognized. Annual Contract Value (ACV) is the average annualized value of a single customer contract.
Formula
Benchmark range
There's no single, universally accepted ACV benchmark for SaaS. It varies greatly based on factors like the company's stage, target market, and pricing model. However, the 2024 Keybanc Capital Markets and Sapphire Ventures SaaS survey finds that for SaaS companies with a six-month sales cycle, the median ACV is $62,000.
Example
A SaaS company closes 10 new contracts in a quarter: 5 at $12,000/year and 5 at $24,000/year.
Bookings = (5 × $12,000) + (5 × $24,000) = $180,000
ACV = $180,000 ÷ 10 = $18,000
Sales efficiency metrics evaluate how effectively a SaaS company turns its sales and marketing investments into recurring revenue growth. These metrics are important for assessing whether go-to-market strategies are delivering sustainable, scalable results.
The SaaS Magic Number measures how many dollars of new recurring revenue are generated for every dollar spent on sales and marketing in the previous quarter. This metric reveals whether those investments are paying off quickly enough to justify additional spending.
Formula
SaaS Magic Number = (Current Quarter Revenue − Previous Quarter Revenue)×4 ÷ Previous Quarter’s Sales & Marketing Expenses
Benchmark range
As per the 2024 Keybanc Capital Markets and Sapphire Ventures SaaS survey report, 0.7 is the standard.
According to the Corporate Finance Institute:
Example
Suppose a SaaS company’s revenue increased from $2.0 million to $2.5 million quarter-over-quarter, and it spent $1.5 million on sales and marketing in the previous quarter.
SaaS Magic Number = ($2.5M − $2.0M) × 4 ÷ $1.5M
= $2.0M ÷ $1.5M
= 1.33
Here are three best practices to help you track SaaS financial metrics effectively and connect them to long-term growth:
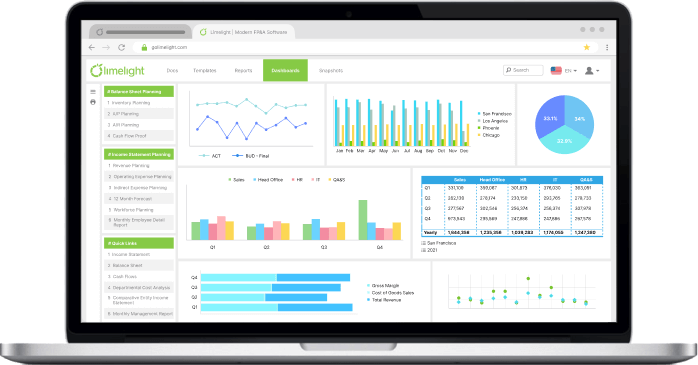
Having the right tools that offer clear visibility into core metrics is essential. FP&A platforms like Limelight provide comprehensive dashboards that visualize key metrics such as MRR, churn, CLTV, and CAC in real-time.
Cohort analysis involves grouping customers based on acquisition date, plan type, or behavior. It enables finance teams to understand retention patterns, assess the impact of marketing campaigns, and evaluate customer lifetime value more precisely. This granular view helps identify the most profitable segments and where to focus retention efforts.
Use data-driven optimization to continuously improve financial performance. Test different pricing tiers, onboarding flows, and retention tactics, and measure their impact on key metrics. A/B testing marketing messages or feature rollouts can uncover what resonates most with your audience.
Tracking SaaS financial metrics manually is both challenging and inefficient. Adopting robust tools makes tracking effortless while giving you access to deeper insights.
Here are the top five SaaS metric tracking tools every finance team should consider:

Limelight SaaS financial metrics tracking tool overview
Limelight is a modern, Excel-free, cloud FP&A platform purpose-built for SaaS companies. It enables real-time, multi-dimensional tracking and analysis of critical financial metrics to drive faster, more informed decisions.
Key features include:

Cube SaaS financial metrics tracking tool overview
Cube is a spreadsheet-native FP&A tool that integrates seamlessly with existing spreadsheets. It simplifies SaaS metric tracking while maintaining the familiarity of Excel or Google Sheets.
Key features include: automated tracking and visualization of core SaaS KPIs such as MRR, ARR, churn, and CAC; centralized data integration from multiple sources; and customizable dashboards and reporting tools for analysis of SaaS metrics.

Workday Adaptive Planning SaaS financial metrics tracking tool overview
Workday Adaptive Planning is a cloud-based platform that helps SaaS companies forecast and analyze key financial metrics to support agile, data-driven growth.
Key features include: cohort modeling for subscriber retention, lead conversion, and contract ramping; forecasting tools for new and renewal ACV/ARR, retention, and churn; and real-time dashboards and scenario planning to assess the impact of pricing, churn, or renewal changes.

Anaplan SaaS financial metrics tracking tool overview
Anaplan is a cloud-based planning and analytics platform that enables SaaS companies to plan, model, and report on critical subscription metrics in real time, supporting agile, data-driven decision-making across finance and operations.
Key features include: recurring revenue modeling for MRR, ARR, renewals, and cohort-based growth; and driver-based scenario planning with interactive dashboards.

Vena SaaS financial metrics tracking tool overview
Vena is a centralized financial planning and analysis platform that enables SaaS companies to measure, monitor, and analyze key SaaS metrics in real time, supporting smarter, data-driven decisions for growth and retention.
Key features include: real-time tracking of ARR, MRR, churn, subscriber count, CAC, CLTV, and gross margin; customizable KPI dashboards to identify trends and share insights; and scenario modeling to test assumptions and forecast outcomes.
Limelight SaaS FP&A tool overview
Tracking SaaS financial metrics using spreadsheets is time-consuming, error-prone, and difficult to scale. Manual workflows lack real-time collaboration, automation, and visibility, slowing down decision-making across finance teams.
Limelight is an Excel-free FP&A platform designed specifically for SaaS companies. It simplifies the tracking of key metrics like MRR, ARR, CAC, CLTV, Churn Rate, and NRR, helping finance leaders plan faster, forecast accurately, and drive strategic growth.
Here’s how Limelight empowers finance teams to track SaaS metrics effectively:
Limelight integrations for centralized data feature overview
Limelight integrates directly with ERPs, CRMs, payroll systems, and other business platforms to consolidate all financial data—recurring revenue, churn, CAC, and more—into a single, always up-to-date source of truth. This centralization reduces manual errors, improves forecasting accuracy, and enables faster decision-making.
Limelight SaaS-specific metric reporting feature overview
With customizable dashboards and pre-built widgets, users can visualize and drill into key SaaS financial metrics. Real-time filters and dynamic reports let teams analyze performance by customer cohort, product line, region, or time period—delivering the granular insights needed to drive growth and retention.
Limelight multi-dimensional planning feature overview
Multi-dimensional planning helps optimize CAC by identifying high-ROI acquisition channels across subscription tiers, customer segments, and regions. It also enables advanced variance analysis and what-if modeling to assess the impact of pricing changes, new product launches, or shifts in customer behavior.
Limelight pre-built templates overview
Use ready-to-use templates designed for core SaaS KPIs like ARR forecasting, churn modeling, CAC payback, and MRR tracking. These templates eliminate setup complexity, so your team can focus on metric analysis, not spreadsheet maintenance.

Limelight interactive dashboard overview
Visualize critical SaaS metrics through real-time dashboards. Track MRR trends, churn rate fluctuations, and CAC efficiency using intuitive charts and graphs. Drill-down views let you explore the drivers behind any metric instantly.
With these powerful features at your disposal, you can transform how your finance team tracks, analyzes, and acts on key SaaS financial metrics.
Book a personalized demo to see how Limelight helps SaaS finance teams move beyond Excel and track the metrics that matter—accurately, automatically, and in real-time.
These typically include metrics like Monthly Recurring Revenue (MRR), Annual Recurring Revenue (ARR), Gross Margin, Customer Acquisition Cost (CAC), Customer Lifetime Value (CLV or LTV), Churn Rate, Net Revenue Retention, CAC Payback Period, and the Rule of 40.
MRR measures subscription revenue on a monthly basis, giving insight into short-term performance and cash flow. ARR is simply the annualized version of recurring revenue, useful for long-term planning and stability forecasting.
It helps you understand how efficiently you acquire customers vs how much value they bring over time. A healthy ratio (often around 3:1 or higher) shows acquisition costs are justified, and it guides marketing, pricing, and retention strategies.
The Rule of 40 is a heuristic that says growth rate + profit margin should be ≥ 40%. It helps align growth and profitability targets, especially for SaaS companies balancing aggressive expansion with sustainable margins.
By integrating real-time data (subscription, churn, expansion), analyzing trends over time, comparing scenario models, and using dashboards that pull together MRR, ARR, churn, CAC, etc. Consistent tracking and data integrity are keys.
High churn erodes recurring revenue, reduces lifetime value, increases pressure on acquisition costs, and makes growth less predictable. Keeping churn low is critical to ensure stable revenue, maintain profitability, and improve investor confidence.
Subscribe to our newsletter