
%20(1).svg)

By Limelight Team |
Last Updated: September 01, 2026

Your chart of accounts is the layer everything else is built on. Every budget, every board report, and every line on your Form 990 traces back to how you set up your accounts. Get the structure right and reporting is fast. Get it wrong and nonprofit finance teams end up stuck with workarounds until a painful redesign forces the issue. This guide walks through the structure, a worked example, and the practices that keep a COA useful as you grow.
Start with what a nonprofit chart of accounts is and the one structural difference that sets it apart from a for-profit.
A nonprofit chart of accounts is the numbered list of every account your organization uses to record transactions. Think of it as the index for your general ledger: it tells your accounting system where each dollar of activity belongs. It sits at the center of nonprofit accounting, and it drives your financial statements and your annual filing.
With that difference in mind, here is how the categories break down.
Almost every nonprofit COA uses the same five categories, each assigned a standard number range. Keeping to these ranges is what lets an auditor, a bank, or a new controller read your books without a translation guide.
|
Number range |
Category |
What it holds |
|---|---|---|
|
1000–1999 |
Assets |
Cash, receivables, prepaid expenses, property and equipment |
|
2000–2999 |
Liabilities |
Accounts payable, accrued expenses, deferred revenue, debt |
|
3000–3999 |
Net assets |
With donor restrictions, without donor restrictions, board-designated |
|
4000–4999 |
Revenue |
Contributions, grants, program fees, events, investment income |
|
5000+ |
Expenses |
Salaries, benefits, occupancy, program and support costs |
Assets, liabilities, revenue, and expenses work much as they do in any organization. Net assets are where nonprofit rules take over, so they deserve a closer look.
Under FASB's ASU 2016-14, nonprofits report net assets in two classes rather than the three used before 2018. The net asset classification rules come down to a single question: did a donor attach a condition to how or when the money can be used?
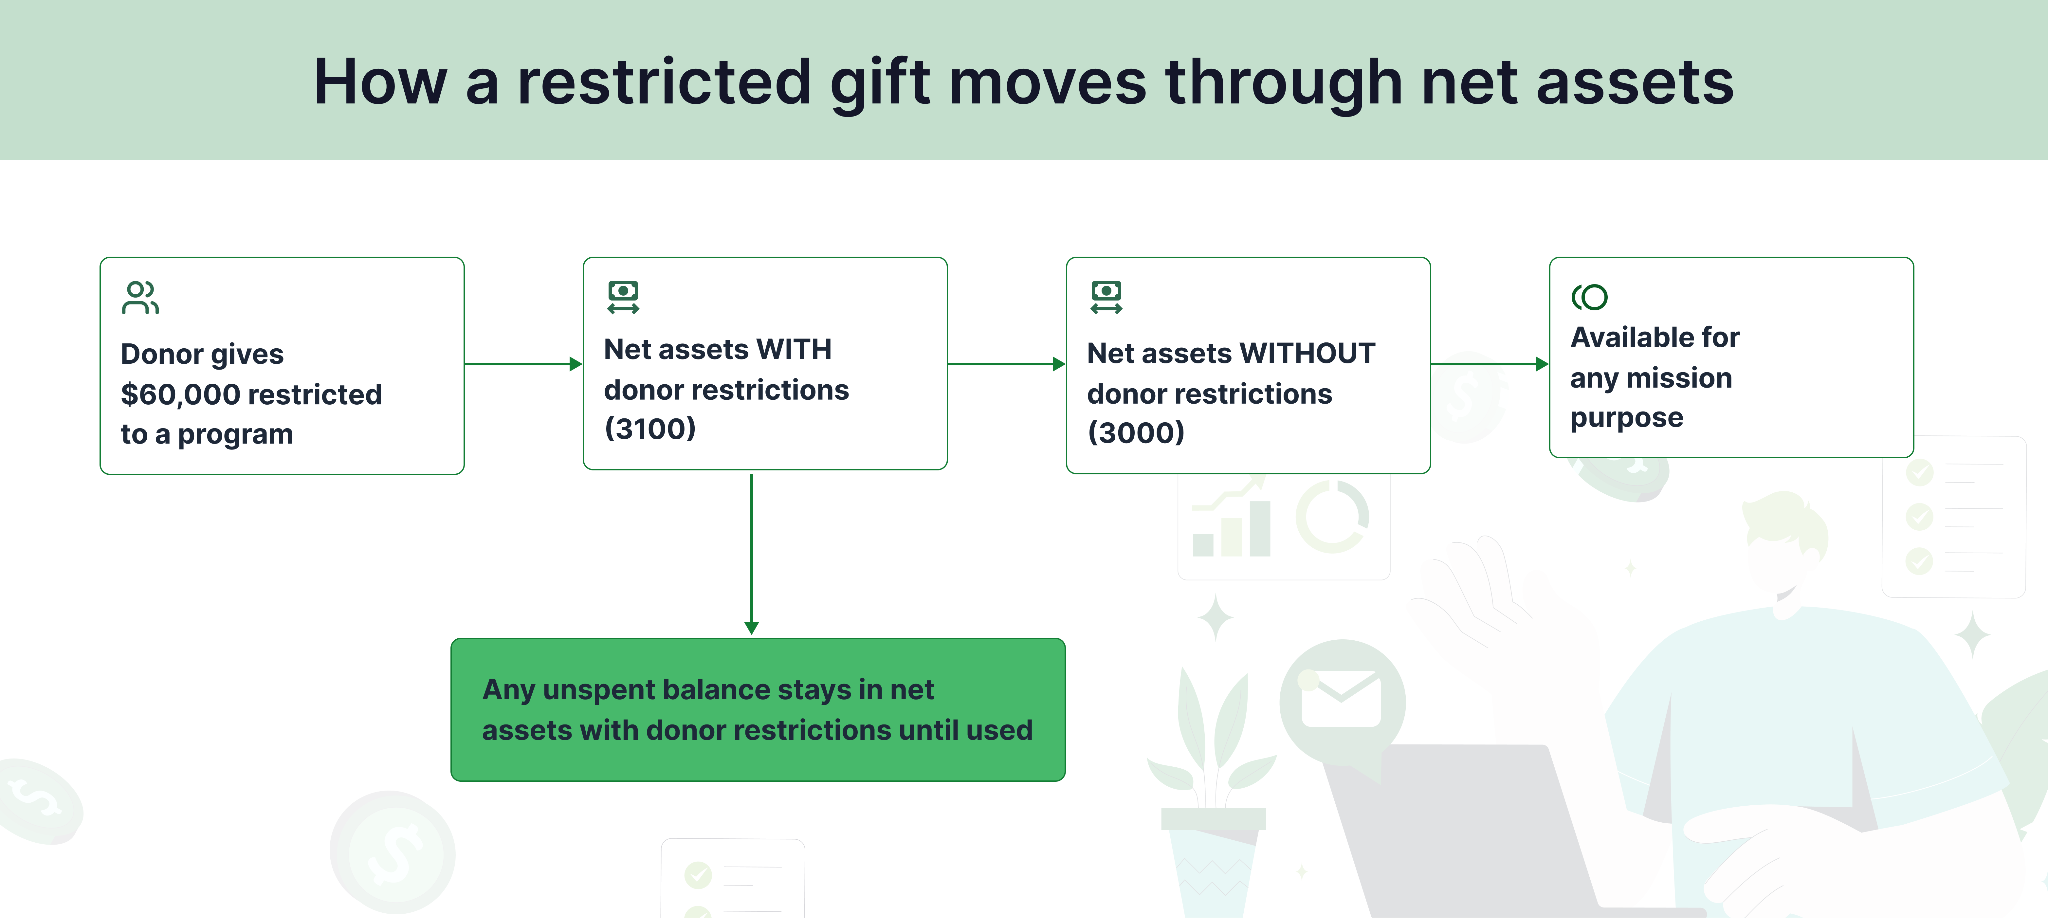
Here is how that plays out in practice. Say a community food bank receives a $60,000 grant restricted to launching a mobile pantry. The money does not sit in one place. It moves as the program spends, and the accounts have to record each step.
|
Event |
Account touched |
Effect on the books |
|---|---|---|
|
Grant received ($60,000) |
Grant revenue, with donor restrictions (4100) |
Restricted revenue recognized; net assets with donor restrictions (3100) rise by $60,000 |
|
Program spending ($45,000) |
Program expenses (5000s) |
Expenses recorded; $45,000 is released from restricted (3100) to unrestricted (3000) |
|
Year-end |
Net assets with donor restrictions (3100) |
The unspent $15,000 stays restricted until the program uses it |
Getting net assets right at the account level is what makes restricted-fund reporting work later. Numbering and segments are the next piece of that foundation.
A good numbering scheme does two jobs: it groups related accounts together and it leaves room to grow. The rules below take about ten minutes to apply and save hours of cleanup down the road.
Resist the urge to add an account every time a new activity appears. Detail belongs in segments, not in a longer account list.
Once the structure and numbering are set, the payoff shows up in how cleanly your accounts feed compliance reporting.
Nonprofits report expenses two ways at once: by nature (what you bought, such as salaries or rent) and by function (why you spent it). ASU 2016-14 made the statement of functional expenses a requirement for all nonprofits, so your expense accounts and your operating expenses need to allocate across three functions.
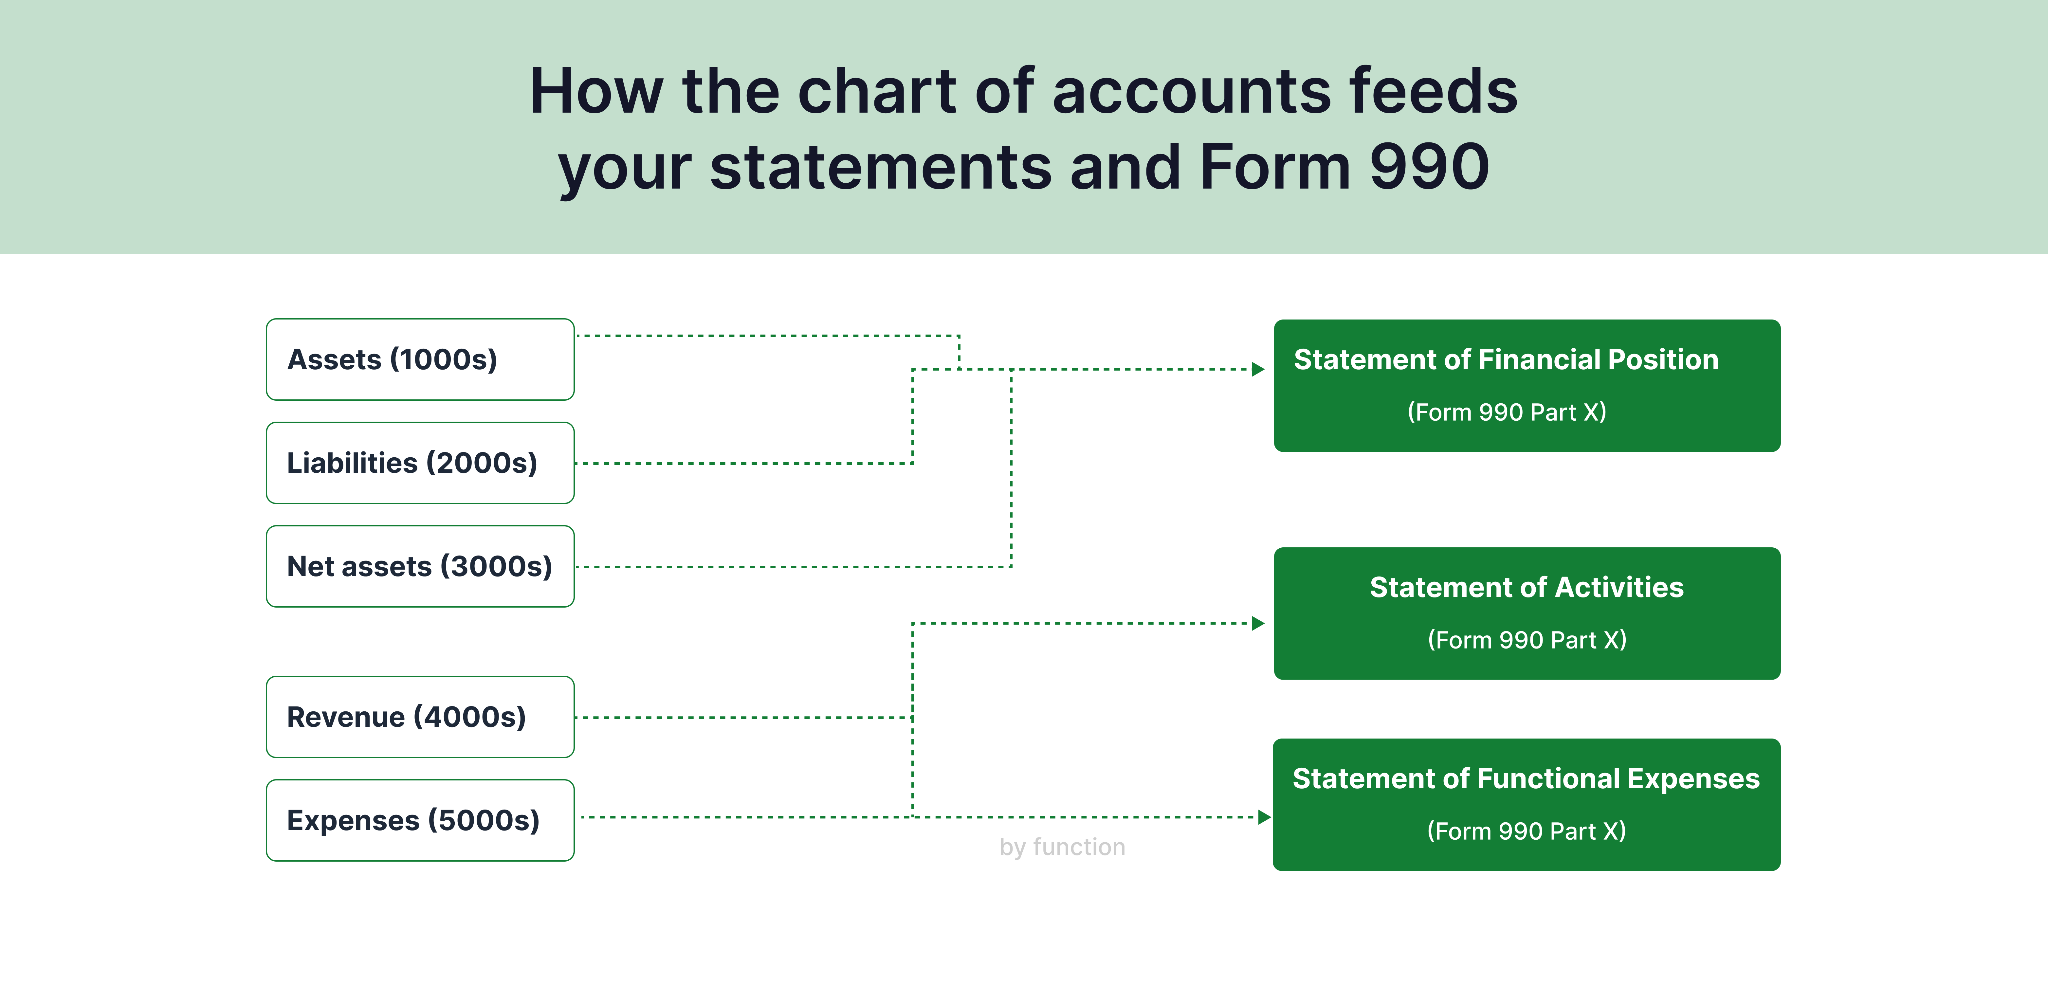
Designing your accounts to line up with the IRS Form 990 turns filing season from a reconstruction project into an export. The mapping is direct.
|
Form 990 section |
What it reports |
Maps from your COA |
|---|---|---|
|
Part VIII |
Statement of Revenue |
Revenue accounts (4000s) |
|
Part IX |
Statement of Functional Expenses |
Expense accounts (5000s), allocated by function |
|
Part X |
Balance Sheet |
Assets, liabilities, and net assets (1000s to 3000s) |
|
WATCH OUT: Functional allocation is only as defensible as the method behind it. If you split occupancy or leadership salaries across functions, document the basis (square footage, time studies, or direct identification) in your notes. Auditors ask, and a percentage with no method behind it is a finding waiting to happen. |
Allocation is easier to see with numbers. Suppose your organization spends $90,000 a year on occupancy and splits it across functions by the share of square footage each one uses.
|
Function |
Basis (sq ft) |
Share |
Allocated cost |
|---|---|---|---|
|
Program services |
6,000 |
66.7% |
$60,000 |
|
Management and general |
2,000 |
22.2% |
$20,000 |
|
Fundraising |
1,000 |
11.1% |
$10,000 |
|
Total |
9,000 |
100% |
$90,000 |
Those functional totals drive the program expense ratio, program spending divided by total spending, that grantmakers and charity watchdogs look at first. If that same organization reports $850,000 in program services against $1,000,000 in total expenses, its ratio is 85 percent. That clears the BBB Wise Giving Alliance Standard 8, which asks charities to spend at least 65 percent of total expenses on program activities, calculated straight from Form 990 Part IX. Treat the ratio as one signal rather than the scoreboard: the Alliance itself notes that finances only tell part of a charity's story.
With the structure and the compliance mapping in place, a full example makes it concrete.
Use the sample below as a starting point, not a finished product. Your programs, funding sources, and assets will shift some of these accounts, but the ranges and the shape hold for most organizations.
|
Account # |
Account name |
Category |
|---|---|---|
|
1000 |
Cash - Operating |
Assets |
|
1010 |
Cash - Savings |
Assets |
|
1200 |
Grants Receivable |
Assets |
|
1500 |
Property and Equipment |
Assets |
|
2000 |
Accounts Payable |
Liabilities |
|
2100 |
Accrued Payroll |
Liabilities |
|
2200 |
Deferred Revenue |
Liabilities |
|
3000 |
Net Assets Without Donor Restrictions |
Net assets |
|
3100 |
Net Assets With Donor Restrictions |
Net assets |
|
3200 |
Board-Designated Net Assets |
Net assets |
|
4000 |
Individual Contributions |
Revenue |
|
4100 |
Grant Revenue |
Revenue |
|
4200 |
Program Service Fees |
Revenue |
|
4300 |
Special Events Revenue |
Revenue |
|
4400 |
Investment Income |
Revenue |
|
5000 |
Salaries and Wages |
Expenses |
|
5100 |
Payroll Taxes and Benefits |
Expenses |
|
5200 |
Program Supplies |
Expenses |
|
5300 |
Occupancy |
Expenses |
|
5400 |
Professional Fees |
Expenses |
A structure like this is easy to read and easy to extend. What separates a COA that lasts from one you rebuild in two years is a short list of practices.
The difference between a COA that scales and one that becomes a liability usually comes down to a few decisions made early.
The mistakes that force a rebuild are the mirror image of those practices.
|
IN PRACTICE: A pattern that shows up often is a separate expense account created for every new grant. Forty grants later, the statement of activities carries hundreds of near-identical lines and no one can produce a clean functional view. The fix is almost always a new dimension, not another account. |
Avoiding those traps keeps the books clean. The larger return comes when that clean structure feeds planning.
A chart of accounts is not the finish line. It is the input that decides how fast everything downstream moves. When accounts and segments are set up well, the work that usually eats a finance team's month gets quicker.
That is the return on getting the structure right, and it is the through-line from a bookkeeping task to strategy.
Build the structure first, keep the account list lean, map revenue and expenses to Form 990, and let segments carry the detail. Do that and your financial statements, your filings, and your board reports all fall out of the same clean foundation instead of a monthly scramble. The chart of accounts is a small artifact with outsized influence over how well your finance function runs.
|
SEE IT IN ACTION: Turn a clean chart of accounts into program budgets, functional forecasts, and board-ready reports without the spreadsheet gymnastics. Book a Limelight demo. |
A nonprofit chart of accounts is the numbered list of every account used to record transactions. It sorts activity into five categories: assets, liabilities, net assets, revenue, and expenses. It forms the backbone of your general ledger, financial statements, and Form 990.
The five categories are assets, liabilities, net assets, revenue, and expenses. Assets and liabilities show what you own and owe. Net assets replace owner equity. Revenue captures income sources, and expenses record spending, usually grouped by function for reporting.
Revenue accounts map to Form 990 Part VIII, and expense accounts map to Part IX, which requires functional allocation across program services, management and general, and fundraising. Designing your accounts to match these lines makes filing faster and cleaner.
The Unified Chart of Accounts is a standardized nonprofit account structure built to align with IRS Form 990 line items. It gives smaller organizations a ready framework, though most nonprofits adapt it to fit their own programs and funding sources.
Use the standard ranges: assets in the 1000s, liabilities 2000s, net assets 3000s, revenue 4000s, and expenses 5000s and up. Space accounts by tens or hundreds so you can insert new accounts later without renumbering the entire chart of accounts.
Subscribe to our newsletter