%20(1).svg)

By Limelight Team |
Last Updated: March 10, 2026

If you’ve ever pulled together nonprofit board reports the week before a meeting, you know the routine. Numbers live in different spreadsheets. Notes sit in email threads. Someone asks for a last-minute update, and now you’re rechecking formulas instead of reviewing what the data is actually saying.
That scramble has a cost. When board members get reports that are hard to follow or packed with raw tables, the meeting drifts into clarifying questions, not decisions. Over time, it can also chip away at confidence, especially when versions don’t match or variances show up without context.
This guide breaks down what nonprofit board reports include, the seven financial reports boards most often rely on, what to include in each, and simple ways to present them so board members can review them quickly and engage in the right discussion.
We’ll also touch on how purpose-built FP&A tools, like Limelight, can help finance teams move from manual reporting to board-ready reporting in minutes.
Nonprofit board reports are structured updates prepared for a board of directors before monthly or quarterly meetings. They combine financial data, operational performance, and leadership commentary to help board members understand how the organization is performing.
These reports serve a dual purpose.
First, they support fiduciary and governance responsibilities. Board members are legally responsible for oversight of the organization’s finances, compliance, and long-term sustainability. Without accurate nonprofit board reports, that oversight becomes guesswork.
Second, nonprofit board reports keep board members engaged. Strong nonprofit financial reporting helps directors participate meaningfully in discussions, ask informed questions, and connect financial results to mission outcomes.
Most nonprofit board reports fall into three categories:
These are formal accounting reports required for proper governance and regulatory compliance. They typically include:
These reports follow U.S. GAAP standards and provide a standardized view of an organization’s financial health.
These reports help boards interpret performance and trends. Common examples include:
Unlike financial statements, management reports focus on insight, not just accounting structure.
This written summary provides context. It explains major variances, highlights risks, outlines strategic progress, and connects financial results to mission delivery.
Historically, nonprofit board reports were distributed as static PDF packets or printed binders. Today, many organizations are shifting toward interactive dashboards and real-time reporting tools. Instead of reviewing outdated numbers, boards can access updated data, drill into variances, and visualize trends more clearly.
Understanding this broader definition is important. Nonprofit board reports are not just about financial statements. They are a complete communication tool that connects governance, strategy, and financial stewardship.
Board members have a legal duty of care and duty of loyalty to oversee the organization’s financial health. That responsibility includes reviewing accurate financial statements and confirming compliance with U.S. GAAP standards. Proper reporting also supports IRS Form 990 disclosures, which require transparency into financial activities and governance practices. Clear nonprofit board reports help boards document oversight, reduce risk, and demonstrate responsible stewardship.
Transparent financial reporting strengthens credibility. Donors, grant-makers, and institutional funders increasingly expect evidence of sound financial management before committing funds. Well-prepared nonprofit board reports show how resources are allocated, how programs perform financially, and whether the organization is operating sustainably. That visibility supports long-term trust.
Boards make decisions about budgets, strategic initiatives, staffing, and capital investments. Without timely nonprofit board reports, those decisions rely on incomplete information. Budget vs actual analysis and cash flow forecasts provide the insight needed to evaluate performance and plan ahead with confidence.
Clear, concise reports help board members prepare for meetings and participate meaningfully. Overly dense or confusing nonprofit board reports can lead to disengagement and surface-level approvals. Structured reporting supports focused discussion and stronger governance.

The 7 nonprofit board reports for finance teams
Strong nonprofit board reports include both required financial statements and management-level insight. Below are the seven reports most boards expect to review, along with what to include and how to make each more effective.
The Statement of Financial Position provides a snapshot of the organization’s assets, liabilities, and net assets at a specific point in time.
Key components to include:
Unlike for-profit organizations, nonprofits report net assets, not equity. This distinction is important for board members reviewing donor restrictions and long-term sustainability.
How often to present it
Monthly or quarterly
What questions it answers
Pro tip
Include a three-year trend comparison so board members can quickly identify changes in reserves, liabilities, or asset growth.
The Statement of Activities summarizes revenue and expenses over a reporting period and shows the change in net assets.
Key components to include:
This report helps boards understand whether the organization is operating within its means.
How often to present it
Monthly, with year-to-date totals
What questions it answers
Pro tip
Break down revenue and expenses by program or fund. This helps the board see which programs are financially sustainable and which require subsidy.
The Statement of Cash Flows tracks actual cash movement through operating, investing, and financing activities.
For nonprofits, this report is critical because accrual accounting may recognize grant revenue before cash is received.
Key components to include:
How often to present it
Quarterly, at minimum
What questions it answers
Pro tip
Include a six-month or 12-month cash flow forecast alongside the historical statement. This shifts the conversation from past activity to future planning.
The Budget vs. Actual report compares budgeted figures to actual performance for the current month and year-to-date.
This is often the most actionable nonprofit board report in a meeting.
Key components to include:
How often to present it
Monthly
What questions it answers
Pro tip
Use color-coding or traffic-light indicators for variances exceeding a set threshold, such as 10%. Visual cues make it easier for board members to focus on areas that need attention.
The Statement of Functional Expenses categorizes expenses by program services, management and general, and fundraising.
This report is required for GAAP-compliant financial statements and IRS Form 990 filings.
Key components to include:
How often to present it
Annually at minimum for GAAP compliance, though many organizations review it quarterly to stay on top of spending patterns
What questions it answers
Pro tip
Include a pie chart or bar graph showing expense ratios. Boards interpret visuals more quickly than tables of numbers.
The Fundraising and Development report tracks fundraising performance, donor trends, and campaign results.
While not required by GAAP, this is essential for revenue sustainability discussions.
Key components to include:
How often to present it
Monthly during active campaigns, quarterly otherwise
What questions it answers
Pro tip
Include year-over-year comparisons and, where possible, benchmark against peer organizations. Trend data provides stronger context than single-period results.
An Executive Dashboard or KPI report is a concise, one-page summary combining financial and programmatic performance indicators.
It connects financial results to mission impact.
Key components to include:
How often to present it
At every board meeting
What questions it answers
Pro tip
Use interactive dashboards that allow board members to drill down into metrics. This reduces time spent explaining numbers and increases time spent on strategic discussion.
Together, these seven nonprofit board reports provide a complete picture of financial health, operational performance, and long-term sustainability. In the next section, we’ll look at common challenges finance teams face when preparing board-ready reporting.

6 best practices for creating nonprofit board reports
Preparing nonprofit board reports is not just about accuracy. It is also about clarity, consistency, and usefulness. The following best practices help finance teams create reports that support governance and meaningful board discussion.
Board members are often volunteers with limited time. Dense spreadsheets with dozens of tabs can discourage engagement. Instead, focus on summary-level reporting supported by charts, graphs, and dashboards.
A practical goal is a board packet that can be reviewed in 30 minutes or less. Visual summaries such as bar charts for budget vs actual results or trend lines for revenue growth make patterns easier to interpret. Detailed backup schedules can be included as appendices for reference.
Clear visuals reduce time spent explaining numbers and increase time spent discussing strategy.
Timely distribution is critical. Sharing nonprofit board reports five to seven days before a meeting gives board members time to review the material and prepare thoughtful questions.
Include a short cover memo highlighting the three most important takeaways. For example:
This framing guides board members toward the key issues without requiring them to sift through every line item first.
A standardized board report template helps board members quickly understand where to find information. When financial reports change format from month to month, it becomes harder to identify trends.
Use consistent:
Consistency builds familiarity. Over time, board members can spot anomalies more easily because they know what “normal” looks like.
Numbers alone do not tell the full story. Effective nonprofit board reports connect financial performance to program outcomes.
For example: Program spending increased 12% this quarter, serving an additional 450 families compared to the same period last year.
Linking financial data to impact reinforces mission alignment and helps board members see how resource allocation supports strategic goals. This is especially important for donor-facing discussions and grant reporting.
A budget vs actual report without explanation creates confusion. Significant variances should always include short, clear commentary.
For example:
Context helps board members distinguish between temporary timing differences and structural financial concerns. It also supports stronger, faster decision-making.
Manual consolidation from spreadsheets increases the risk of formula errors, version control issues, and inconsistent formatting. Connecting your accounting system directly to a reporting platform reduces those risks.
Purpose-built FP&A software can pull real-time data from ERP systems, standardize templates, and generate board-ready nonprofit board reports in minutes rather than hours. This approach improves accuracy, shortens preparation time, and allows finance teams to focus more on analysis and less on reconciliation.
For many organizations, nonprofit board reports still begin in Excel. Spreadsheets feel familiar and flexible. But as reporting complexity grows, that flexibility often becomes a liability.
Here are the most common challenges finance teams face with spreadsheet-based board reporting.
When multiple team members contribute to nonprofit board reports, file versions multiply quickly. Attachments get emailed back and forth. Shared drives hold “Final_v3” and “Final_Updated_Revised.” It becomes difficult to know which file contains the correct numbers.
This creates risk. If outdated figures reach the board, credibility suffers. It also wastes time reconciling versions instead of reviewing insights.
Spreadsheet formulas are powerful, but they are also fragile. Research has found that 94% of spreadsheets used in decision-making contain errors. Even small mistakes in cell references or copy-paste actions can distort totals or variance calculations.
When errors surface during a board meeting, trust erodes. Finance leaders then spend time defending numbers rather than discussing strategy.
Most nonprofits rely on more than one system:
Pulling data from each platform into a master spreadsheet requires repeated exports, uploads, and manual reconciliation. According to a recent FP&A Trends Survey, finance teams spend approximately 45% of their time cleaning and preparing data rather than analyzing it.
That means nearly half of FP&A capacity goes toward consolidation work instead of strategic insight.
Spreadsheets create static reports. Once exported to PDF, nonprofit board reports cannot be updated or explored further.
Board members cannot drill down into line items, filter by program, or view live cash projections. Any follow-up question requires additional manual work. This limits engagement and slows decision-making.
Board packets often require significant formatting: adjusting columns, updating charts, aligning fonts, and reorganizing tabs.
While presentation matters, excessive formatting time reduces the hours available for variance analysis, scenario planning, and forward-looking discussions. The reporting process becomes production-focused rather than insight-focused.
In many organizations, one person becomes the reporting gatekeeper. All data flows through a single spreadsheet owner who understands the formulas and structure.
This creates bottlenecks. If that person is unavailable, reporting stalls. It also limits cross-functional collaboration and transparency.
These challenges are not just operational inconveniences. They directly affect board confidence, governance quality, and financial oversight.
Purpose-built FP&A software addresses these issues by:
Instead of managing spreadsheets, finance teams can focus on analysis, forecasting, and strategic planning.
For nonprofit finance leaders preparing monthly or quarterly board reports, the question is no longer whether spreadsheets work. It is whether they scale.

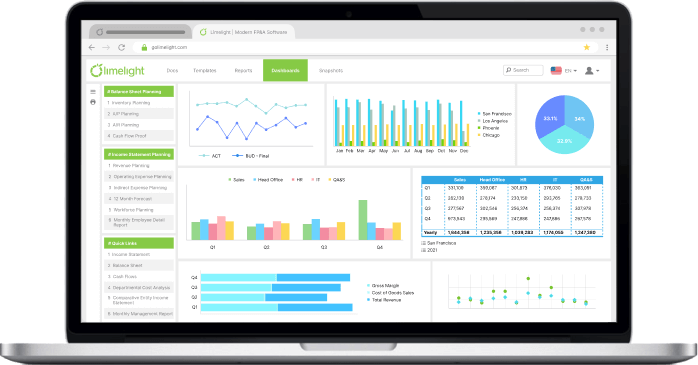
Financial reports for board meetings page of Limelight
Preparing nonprofit board reports should not require days of spreadsheet consolidation. Limelight is built specifically for finance teams that need board-ready reporting without manual version control or formatting work.
Pre-built nonprofit templates provide ready-to-use formats for statements of activities, budget vs actual reports, grant tracking, and program-level reporting. Instead of recreating reports each month, finance teams can generate consistent, presentation-ready board packets aligned with nonprofit reporting standards.
With interactive dashboards, static PDFs are replaced by real-time, filterable views. Board members can review summary metrics, then drill into specific programs, funds, or time periods as needed. This shifts meetings from number review to strategic discussion.
Limelight supports automated data integration with systems such as Sage Intacct, NetSuite, QuickBooks, and other accounting platforms. Data flows directly into reports, reducing manual consolidation and lowering the risk of formula errors.
When board members ask detailed questions, drill-down capabilities allow finance teams to move from high-level summaries to fund-level or transaction-level detail instantly. No separate spreadsheet exports required.
Built-in variance analysis tools calculate budget vs actual differences automatically and allow commentary to be embedded directly within reports. This provides context alongside numbers, not in separate documents.
For organizations managing restricted funding, fund and grant tracking capabilities distinguish between restricted and unrestricted net assets, monitor grant utilization, and support compliance reporting for both boards and funders.
Nonprofit finance teams have seen measurable impact. Communication Services for the Deaf cut its budget cycle time in half. As Ben Daniel, Director of FP&A at CSD, noted, improved reporting processes gave leadership clearer financial visibility and more confidence in planning.

Client testimonial from Communication Services for the Deaf
See how Limelight helps nonprofit finance teams create board-ready reports in minutes. Request a demo.
A nonprofit board report should include core financial statements, management reports, and leadership context. At minimum, boards typically review the Statement of Activities, Statement of Financial Position, Statement of Functional Expenses, cash flow information, and a budget vs actual comparison. Many organizations also include fundraising updates, key performance indicators, and a brief executive summary highlighting major risks, trends, and strategic developments.
Most nonprofits prepare board reports monthly or quarterly, depending on board meeting frequency. Monthly reporting is common for larger organizations or those with complex funding structures.
A nonprofit board report is a comprehensive reporting package prepared for all board members, covering financial performance, operational metrics, and leadership updates. A treasurer report is typically a shorter financial summary presented by the board treasurer during meetings. Treasurer reports often draw from the broader board report but focus primarily on financial highlights and key concerns.
While no federal law mandates specific reports for board meetings, standard governance practice includes reviewing GAAP-compliant financial statements. These generally include the Statement of Financial Position, Statement of Activities, and Statement of Cash Flows. Boards must also oversee Form 990 reporting and confirm financial transparency, making regular financial statement review an essential governance responsibility.
Board reports become more engaging when they are concise, visual, and focused on insights rather than raw data. Use charts, dashboards, and clear variance explanations. Connect financial results to mission outcomes and highlight key takeaways in a cover memo. Structured formatting and consistent templates also help board members review materials more efficiently and participate more actively.
Yes. FP&A software can replace manual spreadsheet consolidation by connecting directly to accounting systems, automating budget vs actual calculations, and generating standardized board-ready reports. These platforms reduce formula errors, improve version control, and enable interactive dashboards. For nonprofits managing multiple funds or grants, software solutions can significantly improve reporting accuracy and efficiency.
Subscribe to our newsletter