
%20(1).svg)

By Limelight Team |
Last Updated: September 01, 2026

Nonprofit budget forecasting is the practice of maintaining a rolling estimate of revenue, expenses, and cash timing, revised monthly against actuals and held separately from the approved annual budget.
It is harder than the commercial version for four reasons: revenue is restricted, cash arrives long after the award, grant periods ignore your fiscal year, and functional expense allocation moves whenever program mix does. Get those four wrong and the arithmetic can be perfect while the plan still fails.
This guide covers the build, in six steps: how to structure the model, which inputs to load, how to weight pipeline revenue, how to run the monthly roll, how to layer scenarios on top, and what the output owes your board and your auditor.
Everything below assumes US GAAP and IRS reporting. If you are still assembling next year's numbers, start with our guide to nonprofit budgeting and come back here once it is approved. For the wider strategic picture, our overview of nonprofit financial planning sets the context.
Start with the split, because everything downstream depends on it. Most nonprofit finance teams maintain one spreadsheet and call it both things. That single decision creates the drift that shows up in October. A document serving as an approved commitment cannot also serve as a live estimate; the two have different owners, different revision rules, and different audiences.
|
Budget |
Forecast |
|
|---|---|---|
|
Purpose |
A commitment. What the board approved you to spend and expected you to raise. |
An estimate. What you now believe will happen given actuals to date. |
|
Time horizon |
Fixed to the fiscal year. |
Rolling. Typically the next 12 months regardless of fiscal boundary. |
|
Revision cadence |
Set once, amended only by board action. |
Revised monthly against close. |
|
Question it answers |
Are we authorized to do this? |
Are we still going to be able to do this? |
|
Primary audience |
Board and funders. |
Executive team and finance. |
One further distinction is worth holding onto, because auditors use it precisely. The AICPA separates a forecast, which reflects the conditions an organization actually expects, from a projection, which reflects hypothetical conditions used to test a question. When you model the loss of your largest funder, you are building a projection, not a forecast.
Keeping the two labeled separately prevents a stress test from quietly becoming the plan of record. Our glossary entry on the rolling forecast covers the mechanics in more depth.
Naming the split is necessary but not sufficient. The nonprofit version of forecasting carries four structural complications that the commercial version never has to solve.
The whole build runs on one model and one monthly cycle. Each step below produces something the next one needs, so they run in order the first time and then repeat as a loop:
Structure comes before numbers, because the four features below cannot be bolted on later. Four features of nonprofit funding break assumptions commercial models take for granted: that revenue is fungible, that revenue arrives near the time it is earned, that the planning period matches the funding period, and that cost allocation is stable. Each one becomes a dimension in the model rather than a workaround in a formula.
A commercial forecast can treat total revenue as a single pool. A nonprofit forecast cannot. Donor restriction is a legal constraint on use, not a labeling preference, and net assets with donor restrictions cannot fund a general operating shortfall no matter how large the balance looks on the statement of financial position.
This is not a theoretical problem. Communication Service for the Deaf, a deaf-led social impact organization in Austin, Texas that has operated for over 40 years, ran its planning out of spreadsheets that reached one to two thousand rows. Ben Daniel, CSD's Director of Financial Planning and Analysis, described the difficulty as one of resolution rather than arithmetic.
The numbers were all there. Getting a summary by department, locality, or account meant scrolling and filtering rather than reading. When restriction status is a filter you apply by hand, availability is something you reconstruct on request instead of something the model knows.
Worked model. Take an organization forecasting $4.2 million in revenue for the coming fiscal year. The executive director sees a number up 6% on last year and asks finance whether the organization can absorb a $250,000 facilities repair. Here is what the revenue actually consists of:
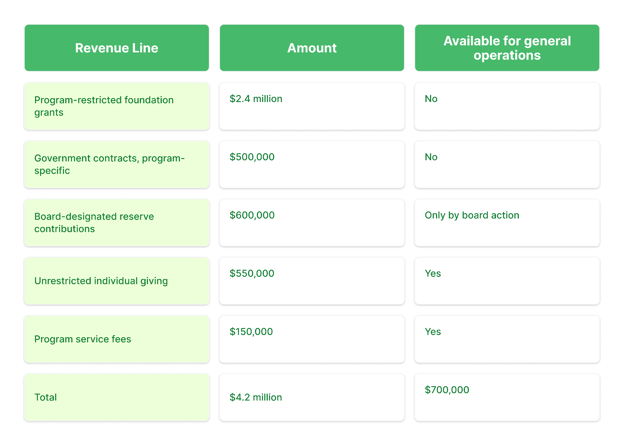
The answer to the facilities question is no, or not without board action on the designated reserve. The $4.2 million figure would have suggested otherwise. This is where the distinction stops being technical. The executive director was not misinformed about the revenue; they were misinformed about the capacity, and telling those apart is the forecast's job.
A forecast built on the $4.2 million figure overstates general operating capacity by a factor of six. The fix is structural rather than analytical. Carry restriction status as a dimension on every revenue line, so availability is a calculated output instead of a quarterly reconstruction by hand.
Government and many foundation awards are reimbursement-based. You deliver the program, you document the spend, you invoice, and then you collect. Each of those is a separate date. The gap between the first and the last is where cash crises live.
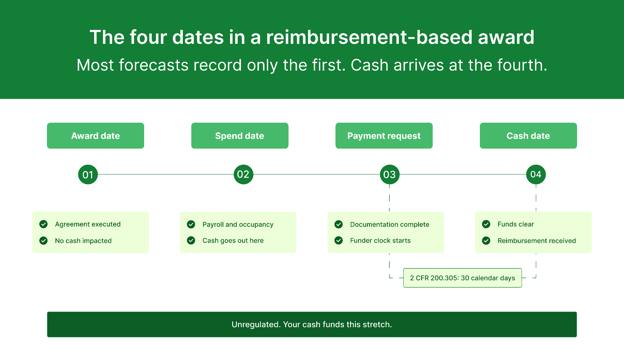
Federal rules set the outer boundary, and reading them carefully is what makes the gap predictable. Under 2 CFR 200.305, when the reimbursement method is used, the agency or pass-through entity must pay within 30 calendar days after receiving the payment request. That sounds fast. The trap is what the 30 days does not cover.
Worked model. An organization holds a $900,000 pass-through award for youth services, reimbursed quarterly on documented spend, executed in July. Program delivery runs July through September and costs $225,000 in payroll and occupancy, paid as incurred. Internal close and documentation take until late October. The payment request goes out in mid-November. The agency pays within its 30 days, in mid-December, in full compliance.
The organization has funded five months of program delivery from its own cash before the first dollar arrives, and the funder did nothing wrong. The regulation governs one stage of four; internal close, documentation assembly, and agency review all sit outside it, and a request returned for correction restarts the clock. This is the contract working exactly as written, and a forecast recording only the July award date will not show any of it.
Model the spend date and the cash date as separate lines, then let the difference between them drive your cash flow forecasting. Otherwise the year looks healthy on paper while operating cash runs out in month seven.
A three-year award beginning in April sits across four of your fiscal years. Recognizing the full award in the year it is signed inflates that year and starves the next two. The pro-rating rule that keeps this honest is simple to state and easy to skip:
Worked example. A $900,000 three-year capacity-building award begins April 1 against a fiscal year ending June 30. The funder front-loads it: $450,000 in year one, $300,000 in year two, $150,000 in year three. Recognized on the award date, it produces a fiscal year with $900,000 of apparent new revenue and two subsequent years that look like collapse. Allocated on the funder's schedule, it produces $112,500 in the first fiscal stub, then $412,500, then $262,500, then $112,500. The second version is the one you can plan staffing against. For the underlying comparison of period-based approaches, see our guide to budget forecasting methods.
Program, management and general, and fundraising splits are not fixed percentages. They are the output of allocation drivers: staff time, square footage, direct headcount. When your program mix changes mid-year, which is exactly what happens when a funder cuts an award, the allocation changes with it. A
forecast holding last year's percentages constant will misstate program ratios in the direction funders scrutinize most. Our breakdown of operating expense planning covers the allocation mechanics, and our guide to nonprofit accounting covers the reporting requirement behind it.
Worked example. An organization allocates 78% of shared costs to program based on direct staff FTE. A funder cut removes one of four programs in month five, taking 22 FTE with it. Hold 78% constant and program expense stays flat while program revenue falls, so management and general costs appear to have been absorbed by nothing.
Recalculated on actual FTE, the program allocation falls to roughly 68% and the management and general ratio rises by ten points. That is the number a funder reads on your Form 990, and it moved because of an allocation driver, not because anyone made a spending decision.
With those four carried as dimensions, the model has somewhere to put every number. Step 2 is deciding which numbers, and who owns them.
Forecast quality is a function of input discipline, not model sophistication. Five inputs carry almost all of the accuracy, and each one needs a named owner outside finance or it will not get refreshed.
|
Input |
Owner |
Refresh cadence |
Source system |
|---|---|---|---|
|
Committed revenue schedule |
Finance |
Monthly |
ERP and grants module |
|
Probability-weighted revenue pipeline |
Development director |
Monthly |
Donor CRM |
|
Reimbursement timing map |
Grants accounting |
Monthly |
Grant agreements and AR aging |
|
Personnel roll-forward |
Finance with HR |
Monthly |
HRIS and payroll |
|
Allocation driver set |
Finance with program leads |
Quarterly |
Time studies, FTE counts, square footage |
Notice that three of the five owners sit outside finance. That is the practical argument for driver-based planning: when the forecast is built on drivers program and development staff already track, those teams update their own inputs instead of finance chasing them by email.
Connecticut Green Bank is a working example of the principle outside conventional grant funding. Its finance team models budgets against operational drivers such as solar production rather than against last year's expense lines, which lets assumptions and scenarios be adjusted in minutes. Jane Murphy, VP of Finance and Administration, describes the change as consolidation more than speed: processes once broken apart across numerous spreadsheets and disparate systems now run from one place.
Four of those five inputs record things that already happened. The fifth, the pipeline, is a judgment call about revenue that has not arrived. The temptation with pipeline revenue is binary treatment: count it or do not. Both are wrong. Counting a submitted application at full value builds a forecast on hope, and excluding it entirely produces a forecast so conservative that leadership stops using it for decisions. Probability weighting by pipeline stage is the middle path, and it works because it is auditable.
|
Pipeline stage |
Starting weight |
Why |
|---|---|---|
|
Executed agreement |
100% |
Legally committed. Only timing risk remains. |
|
Renewal, funder has confirmed intent in writing |
80% |
High confidence, but amount and timing frequently shift. |
|
Renewal, no confirmation, three or more years of history |
60% |
Base rate from your own renewal history, not a general assumption. |
|
Application submitted, decision pending |
30% |
Adjust to your organization's actual win rate on submitted applications. |
|
Identified opportunity, not yet submitted |
0 to 10% |
Excluded from the operating forecast. Track it, do not spend it. |
Those weights are a starting point, not a standard. Replace every one of them with your own historical rate within two forecast cycles, because a national average tells you nothing about how your specific funders behave. Alongside the weights, each material revenue line should carry an assumption record with four fields:
A structured model with weighted inputs is a snapshot. The monthly cycle is what keeps it true. The annual reforecast is the wrong instrument for a year like this one. By the time a mid-year reforecast is complete, the conditions that triggered it have moved. A rolling forecast replaces it with a 12-month forward view that advances one month at every close, so the horizon never shortens and the model never goes stale.
The monthly cycle runs in six stages, and the whole thing should take less time than the close before it:
What separates a working cycle from a monthly rebuild is knowing what stays fixed. These four elements do not change between closes unless something material happened:
GET STARTED
See how nonprofit finance teams run this cycle inside a connected model. Explore Limelight for nonprofits.
A forecast that tracks availability well gives you the base case you need to test what happens when funding moves against you.
Those three figures are why the scenarios below are the ones worth modeling: thin cash, foundation revenue coming in under plan, and a deficit year already behind you. Best case, worst case, and likely case are not scenarios. They are moods. A scenario is useful only when it names a specific event, quantifies the effect on the model, and carries a response the board has already agreed to.
|
Scenario |
Trigger to watch |
What changes in the model |
Pre-agreed response |
|---|---|---|---|
|
Reimbursement delay of 60 to 90 days |
Average days from invoice to cash exceeds your rolling 12-month average by 20 or more days |
Cash dates shift out. Award and revenue lines unchanged. Months of cash on hand falls. |
Draw on the line of credit at a named threshold. Defer specified discretionary spend. Notify the board finance chair. |
|
Loss of largest single funder |
Renewal not confirmed 90 days before period end |
Remove the weighted line entirely. Reallocate the functional expense drivers tied to that program. |
Named program wind-down sequence with dates. Development escalation to the identified replacement pipeline. |
|
Flat renewals with cost inflation |
Renewal amounts at prior-year level while personnel and occupancy costs rise |
Revenue flat, expense drivers up. Margin compression across every program. |
Compensation and headcount decisions made at a stated month, not deferred to year end. |
Worked example, scenario one. The organization above carries 2.8 months of cash. Its reimbursement-based contracts represent $1.4 million of annual spend, roughly $117,000 a month in outflow funded ahead of collection. A 60-day extension in reimbursement timing means holding an additional $234,000 of working capital with no change to revenue at all. Against 2.8 months of cash, that is roughly three weeks of runway lost to timing alone. The trigger is measurable in the AR aging report, and the response, drawing on the line of credit at a stated threshold, can be approved by the board before it is needed rather than during the week it becomes urgent.
Run these as projections against your forecast base case rather than editing the forecast itself, which preserves the distinction the auditors care about. Our overview of FP&A modeling covers how to structure the underlying models.
That work is only valuable if it reaches the people who make the decisions. Boards are frequently given a budget-to-actual variance report and asked to draw conclusions from it. That report answers a question about the past. What a board needs in a volatile funding year is a forward view with decisions attached to it.
Structuring the pack this way changes what the meeting is for. Our guide to the FP&A process covers how that reporting cadence fits the wider planning cycle.
The same availability discipline pays a second time, at audit. FASB ASU 2016-14 requires not-for-profit entities to disclose both quantitative and qualitative information about the financial assets available to meet general expenditures within one year of the balance sheet date, together with the policies used to manage liquidity. The quantitative half is a number that must account for donor restrictions, contractual limits, and board designations. If that sounds familiar, it should. It is the same availability calculation your forecast already performs every month.
IN PLAIN ENGLISH: Your forecast is an audit input
Most nonprofits reconstruct the liquidity and availability disclosure once a year, by hand, during audit prep. If the forecast model carries restriction status as a dimension on every revenue line, the availability figure becomes a query rather than a project. The qualitative half of the disclosure, which describes how the organization manages liquidity, is your rolling forecast cycle written down.
This does not replace your accounting system, and the forecast is not the source of record for the statements themselves. Our guide to nonprofit financial statements covers the reporting package and where each disclosure belongs. What the forecast does is make the availability number defensible, because you can show the month-by-month record of how it was derived instead of a year-end reconstruction.
What tends to stop teams is not knowing what to report or disclose. It is that producing it monthly by hand is not sustainable.
Excel is a reasonable place to build a first rolling forecast, and plenty of organizations run one successfully for years. The honest question is not whether spreadsheets work. It is which specific failures indicate you have passed the point where they do, and there are four:
CSD reached that point and moved its planning onto a connected platform integrated with Sage Intacct, cutting its annual budgeting process in half. Connecticut Green Bank consolidated 30 separate reports and spreadsheets into a single source of truth. Neither organization changed what it was forecasting. Both changed where the forecast lived, and got back the weeks that consolidation had been consuming.
When two or more of those symptoms are true in consecutive months, the constraint is the tool. Purpose-built nonprofit budget software addresses them by holding restriction status, allocation drivers, and assumption history as structured data rather than formulas.
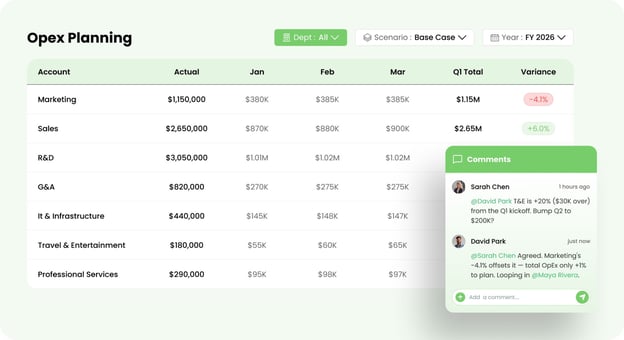
Limelight is a cloud FP&A platform built for finance teams at US organizations with 500 to 5,000 employees, and nonprofits are one of its core verticals. Its planning and forecasting capabilities support unlimited custom dimensions, which lets restriction status and functional expense drivers sit as dimensions on the model rather than as columns bolted onto a spreadsheet. It connects natively to Sage Intacct, NetSuite, Microsoft Dynamics, QuickBooks Online, and Blackbaud, so actuals flow into the forecast without a manual export step each month.
For a wider view of the category, see our comparison of the best nonprofit budgeting software.
|
What it addresses |
How |
|---|---|
|
Version conflict |
Multiple owners update their own inputs in one shared model with role-based access, so there are no versions to reconcile. |
|
Allocation breakage |
Allocation drivers are modeled as dimensions, so a change in program mix flows through without formula rework. |
|
Assumption audit trail |
Changes are logged with user and timestamp, which supports both board reporting and the ASC 958 qualitative disclosure. |
|
Reforecast speed |
Actuals refresh directly from the ERP. Typical deployments run 90 days, with some clients live in two to three weeks. |
Limelight holds a 4.7 out of 5 rating on G2 across 15 verified reviews, with pricing starting at $1,400 per month, and nonprofit discounts are available. If you are earlier in the evaluation, our overview of cash flow forecasting tools covers the adjacent decision.
SEE IT IN PRACTICE
Book a walkthrough of Limelight for nonprofits and see a rolling forecast with restriction tracking and reimbursement timing already modeled.
Structure the model so restriction status, spend date, and cash date are dimensions. Load five inputs: committed revenue, weighted pipeline, reimbursement timing, personnel roll-forward, and allocation drivers. Weight pipeline revenue by stage, then roll the forecast forward one month at every close and publish availability and months of cash to the board.
A budget is an approved commitment fixed to the fiscal year and amended only by board action. A forecast is a live estimate, revised monthly against actuals, usually rolling 12 months forward. The budget authorizes spending. The forecast tells you whether it remains possible.
Monthly, immediately after close. A rolling 12-month forecast advances one month at each close so the horizon never shortens. Annual or semi-annual reforecasting leaves the organization blind during exactly the periods when funding conditions change fastest.
Carry restriction status as a dimension on every revenue line, then forecast availability rather than total revenue. Donor-restricted amounts cannot cover general operating shortfalls, so a forecast built on the top-line figure will systematically overstate your planning capacity.
There is no universal figure. More than half of nonprofits hold three months or less (Nonprofit Finance Fund, 2025). Your target should be set by board policy against your specific reimbursement lag and funder concentration, then tracked forward in the forecast.
Yes. ASU 2016-14 requires disclosure of financial assets available for general expenditure within one year, plus your liquidity management policies. A forecast that tracks availability monthly produces most of that disclosure as a byproduct rather than an annual reconstruction.
Yes, until four things happen: version conflicts during refresh, allocation formulas breaking on program mix changes, no audit trail on assumption changes, and reforecasting taking longer than the close. Two or more in consecutive months means the tool is the constraint.
Subscribe to our newsletter