%20(1).svg)
Welcome to your comprehensive resource for understanding financial statement analysis. This glossary serves as your go-to reference for key terms, concepts, and methodologies that form the backbone of financial analysis. Whether you're a finance professional, investor, or business owner, this guide will help you navigate the complex world of financial statements with confidence.
Financial statement analysis can feel overwhelming when you're juggling multiple data sources and trying to make sense of numbers scattered across different systems. That's exactly why having a solid foundation in these core concepts matters - it transforms raw data into actionable insights that drive better business decisions.
Introduction to Financial Statement Analysis
Financial statement analysis is the process of examining a company's financial statements to evaluate its performance, financial position, and future prospects. This analytical approach goes beyond simply reading numbers on a page; it involves interpreting data to understand the story behind a company's financial health.
The practice serves multiple stakeholders with different needs. Investors use it to make informed decisions about buying, holding, or selling securities. Creditors rely on it to assess creditworthiness and lending risks. Management teams leverage these insights for strategic planning and operational improvements. Even employees and customers benefit from understanding a company's financial stability.
What makes financial statement analysis particularly valuable is its ability to transform historical data into forward-looking insights. By identifying trends, comparing performance against industry benchmarks, and spotting potential red flags, analysts can make predictions about future performance and identify opportunities for improvement.
Key Financial Statements
Understanding the primary financial statements forms the foundation of effective analysis. Each statement tells a different part of the company's financial story, and together they provide a complete picture of business performance.
1. Balance Sheet
The balance sheet presents a company's financial position at a specific point in time, much like a financial snapshot. It follows the fundamental accounting equation: Assets = Liabilities + Shareholders' Equity.
- Assets represent everything the company owns or controls that has economic value. These include current assets (cash, inventory, accounts receivable) that can be converted to cash within a year, and non-current assets (property, equipment, intangible assets) that provide long-term value.
- Liabilities encompass all debts and obligations the company owes to external parties. Current liabilities must be paid within one year, while long-term liabilities extend beyond that timeframe.
- Shareholders' Equity represents the residual ownership interest in the company after subtracting liabilities from assets. This section includes contributed capital from investors and retained earnings from profitable operations.
The balance sheet's strength lies in revealing a company's liquidity position, debt levels, and overall financial stability. However, it reflects historical costs rather than current market values, which can limit its usefulness for certain analyses.
2. Income Statement
The income statement, also known as the profit and loss statement, measures a company's financial performance over a specific period. Unlike the balance sheet's point-in-time view, this statement shows the flow of revenues and expenses during a particular timeframe.
- Revenue represents the total amount earned from selling goods or services during the period. This top-line figure indicates the company's ability to generate sales and grow its business.
- Expenses include all costs incurred to generate revenue, such as cost of goods sold, operating expenses, interest payments, and taxes. These are subtracted from revenue to determine profitability at various levels.
- Net Income is the bottom-line result after all expenses are deducted from revenue. This figure shows whether the company generated a profit or loss during the period.
The income statement reveals trends in profitability, expense management, and operational efficiency. It helps stakeholders understand whether the company is growing its revenue, controlling costs effectively, and generating sustainable profits.
3. Cash Flow Statement
The cash flow statement tracks the actual movement of cash in and out of the business during a specific period. This statement is crucial because profitability doesn't always translate to positive cash flow, and companies need cash to meet their obligations and fund growth.
- Operating Activities show cash flows from core business operations, including cash received from customers and cash paid to suppliers and employees. This section reveals whether the company generates positive cash flow from its primary business activities.
- Investing Activities reflect cash flows from buying and selling long-term assets, such as equipment, investments, or acquisitions. These activities typically require cash outflows but are essential for long-term growth.
- Financing Activities include cash flows from transactions with owners and creditors, such as issuing stock, paying dividends, borrowing money, or repaying debt. These activities show how the company finances its operations and returns value to shareholders.
The cash flow statement helps identify potential liquidity issues, evaluate the quality of earnings, and assess the company's ability to fund operations and growth without external financing.
Notes to the Financial Statements
The notes provide essential context and detailed explanations that complement the numerical data in the primary statements. These disclosures are not optional additions - they're integral parts of the financial statements that provide transparency and clarity.
Notes typically include information about accounting policies, significant estimates and judgments, contingent liabilities, subsequent events, and detailed breakdowns of major balance sheet and income statement items. They also disclose information about commitments, guarantees, and other off-balance-sheet arrangements.
For analysts, the notes often contain the most valuable insights. They reveal management's assumptions, highlight areas of uncertainty, and provide details that can significantly impact the interpretation of the financial statements. Ignoring the notes can lead to incomplete or incorrect conclusions about a company's financial position.
Methods of Financial Statement Analysis
Different analytical methods provide unique perspectives on financial performance. Each approach has its strengths and limitations, making it important to use multiple methods for comprehensive analysis.
1. Horizontal Analysis
Horizontal analysis compares financial data across multiple periods to identify trends and patterns over time. This method calculates the percentage change in each line item from one period to another, revealing whether key metrics are improving or deteriorating.
Step 1: Select the base year for comparison (usually the earliest period in your analysis).
Step 2: Calculate the absolute change by subtracting the base year amount from the current year amount.
Step 3: Divide the absolute change by the base year amount and multiply by 100 to get the percentage change.
Step 4: Analyze the trends to identify patterns in revenue growth, expense control, and profitability.
This analysis is particularly useful for identifying growth trends, seasonal patterns, and the impact of specific events on financial performance. However, it can be misleading when the base year contains unusual items or when comparing percentages with small base amounts.
2. Vertical Analysis
Vertical analysis expresses each line item as a percentage of a base figure within the same financial statement. For income statements, each item is typically expressed as a percentage of total revenue. For balance sheets, each item is shown as a percentage of total assets.
Step 1: Identify the base figure (total revenue for income statements, total assets for balance sheets).
Step 2: Divide each line item by the base figure.
Step 3: Multiply by 100 to express as percentages.
Step 4: Compare these percentages across periods or against industry benchmarks.
Vertical analysis helps identify changes in cost structure, asset composition, and financial leverage. It's particularly valuable for comparing companies of different sizes or analyzing how a company's financial structure changes over time.
3. Ratio Analysis
Ratio analysis evaluates relationships between different financial statement items to assess various aspects of company performance. Ratios provide standardized measures that facilitate comparisons across companies and time periods.
Liquidity Ratios measure a company's ability to meet short-term obligations:
- Current Ratio = Current Assets ÷ Current Liabilities
- Quick Ratio = (Current Assets - Inventory) ÷ Current Liabilities
- Cash Ratio = Cash and Cash Equivalents ÷ Current Liabilities
Profitability Ratios assess the company's ability to generate profits:
- Gross Profit Margin = Gross Profit ÷ Revenue
- Operating Margin = Operating Income ÷ Revenue
- Net Profit Margin = Net Income ÷ Revenue
- Return on Assets = Net Income ÷ Total Assets
- Return on Equity = Net Income ÷ Shareholders' Equity
Solvency Ratios evaluate long-term financial stability and debt management:
- Debt-to-Assets = Total Debt ÷ Total Assets
- Debt-to-Equity = Total Debt ÷ Shareholders' Equity
- Interest Coverage = Operating Income ÷ Interest Expense
Activity Ratios measure how efficiently the company uses its assets:
- Inventory Turnover = Cost of Goods Sold ÷ Average Inventory
- Accounts Receivable Turnover = Revenue ÷ Average Accounts Receivable
- Asset Turnover = Revenue ÷ Average Total Assets
Each ratio category provides insights into different aspects of financial performance, and analyzing them together creates a comprehensive view of the company's financial health.
Importance of Financial Statement Analysis
Financial statement analysis serves as the foundation for informed business decision-making across multiple stakeholder groups. Its importance extends far beyond simple number-crunching to encompass strategic planning, risk assessment, and performance evaluation.
- For investors, financial statement analysis provides the data needed to make informed investment decisions. By analyzing profitability trends, growth patterns, and financial stability, investors can identify undervalued opportunities and avoid potential losses. The analysis helps answer critical questions: Is the company growing sustainably? Can it maintain its competitive position? Will it generate adequate returns?
- Creditors rely heavily on financial statement analysis to assess lending risks and determine appropriate terms for loans. Banks and other lenders examine liquidity ratios, debt levels, and cash flow patterns to evaluate a borrower's ability to repay obligations. This analysis directly influences interest rates, collateral requirements, and loan approval decisions.
- Management teams use financial statement analysis for internal performance evaluation and strategic planning. By comparing actual results to budgets and industry benchmarks, managers can identify areas for improvement and make data-driven decisions about resource allocation, pricing strategies, and operational changes.
- Suppliers and customers also benefit from understanding a company's financial health. Suppliers want assurance that customers can pay for goods and services, while customers need confidence that suppliers will remain viable and continue providing products or services.
The analysis becomes particularly crucial during times of economic uncertainty or significant business changes. It helps stakeholders identify early warning signs of financial distress and make proactive adjustments to protect their interests.
Tools and Techniques
Modern financial statement analysis relies on various tools and techniques that enhance the accuracy and efficiency of the analytical process. These range from traditional manual methods to sophisticated software solutions.
- Trend Analysis extends beyond simple horizontal analysis by using statistical techniques to identify patterns and project future performance. This might involve regression analysis, moving averages, or seasonal adjustments to better understand underlying business trends.
- Benchmarking compares a company's performance against industry peers, best-in-class performers, or historical standards. This technique helps identify relative strengths and weaknesses and sets realistic performance targets. Effective benchmarking requires careful selection of comparable companies and adjustment for differences in size, business model, or market conditions.
- Financial Modeling creates mathematical representations of a company's financial performance to test different scenarios and forecast future results. Models might range from simple spreadsheet projections to complex simulations that incorporate multiple variables and uncertainty factors.
- DuPont Analysis breaks down return on equity into its component parts (profit margin, asset turnover, and financial leverage) to identify the primary drivers of profitability. This technique helps pinpoint whether superior returns come from operational efficiency, asset utilization, or financial leverage.
- Common-Size Analysis converts financial statements to percentages, making it easier to compare companies of different sizes or track changes in financial structure over time. This technique is particularly useful for identifying shifts in cost structure or asset composition.
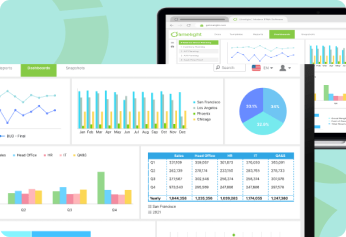
- Technology Solutions have transformed financial statement analysis by automating data collection, calculation, and visualization. Modern FP&A platforms can integrate data from multiple sources, perform complex calculations automatically, and present results through interactive dashboards and reports.
When finance teams struggle with manual data consolidation from multiple systems - spending hours on formatting, error-checking, and version control - these automated tools become essential for maintaining accuracy and efficiency as businesses grow in complexity.
Leveraging Technology for Better Financial Analysis
As financial data grows more complex, spreadsheets become a bottleneck. Modern FP&A platforms connect directly to ERP and accounting systems, automate calculations, and provide real-time reporting-saving time and reducing errors.
Limelight combines the familiarity of Excel with the power of automation to help finance teams deliver faster, more accurate insights.Book a demo to see how Limelight can simplify your financial analysis.
Table of Contents
Ready to put an end to outdated FP&A?
Get a perzonalized demo