Key Takeaways
- Three financial statements-balance sheet, income statement, and cash flow statement—are critical for measuring a company's financial strength and planning future growth.
- Comprehensive financial analysis helps identify trends and areas for improvement through metrics like profit margins, liquidity ratios, and cash flow trends.
- Three-way financial modeling effectively links financial statements for integrated scenario analysis, impacting net income, cash flow, and working capital forecasting.
- Sensitivity analysis involves varying key drivers like sales growth to understand their impact on profitability and cash flow, aiding strategic decision-making.
- Financial ratios such as profitability, liquidity, and solvency ratios offer deeper insights into a company's financial performance and competitive positioning.
- Limelight's FP&A tool enhances financial analysis by providing real-time data and advanced analytics, eliminating data inconsistencies and enabling strategic decision-making.
Companies invest significant time in gathering data and preparing financial statements but struggle to get the most value from them. The complexity of financial reporting arises from managing variables like revenue timing, expenses, and working capital, which distorts the overall financial picture if not carefully handled.
External influences such as market changes or unexpected costs further complicate forecasting. Small errors or incorrect assumptions quickly escalate, making it hard to create reliable projections.
As a result, businesses spend more time resolving data issues than generating deeper analysis from their financial statements.
In this blog post, we will discuss how to use three core financial statements—a balance sheet, income statement, and cash flow statement—to measure a company's strengths and plan for future growth.

How Do You Measure the Financial Strength of a Company?
To achieve a strategic understanding of a company’s financial health, you analyze and forecast the three primary financial statements — the balance sheet, income statement, and cash flow statement.
Each statement provides unique insights and, when interlinked, creates a comprehensive picture of the organization’s performance.
1. Collecting Historical Data
Gather financial statements from previous years, typically spanning the past three to five years. This will establish baselines for key metrics, such as revenue growth rates, expense ratios, working capital, and cash flow trends.
For instance, if you recorded steady revenue growth of 10% per year over the last three years, this trend helps set expectations for future revenue projections.
2. Comprehensive Financial Analysis
Once you have gathered historical financial information, analyze the three key financial statements — the income statement, balance sheet, and cash flow statement.
a. Income Statement Analysis
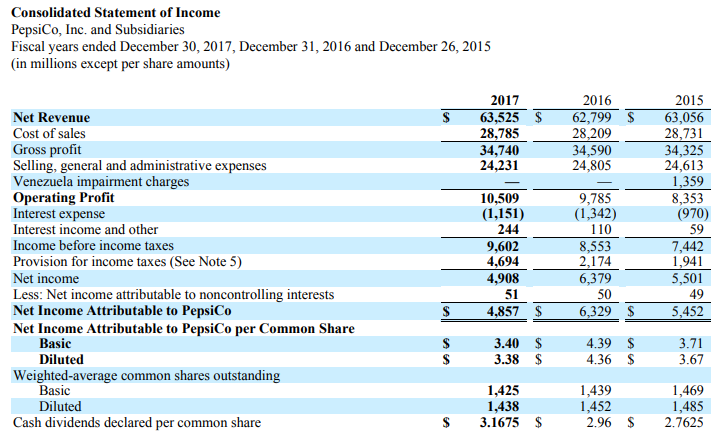
Source
The income statement, also known as the profit and loss (P&L) statement, outlines the company's financial performance over a specific period. It details revenues, expenses, and net income (or loss), allowing stakeholders to assess profitability.
By analyzing key metrics such as profit margins, you identify areas for cost management. You distinguish between fixed and variable costs to understand their behavior relative to changes in revenue. This helps you evaluate the company's ability to generate sustainable profits and track profitability trends.
b. Balance Sheet Analysis
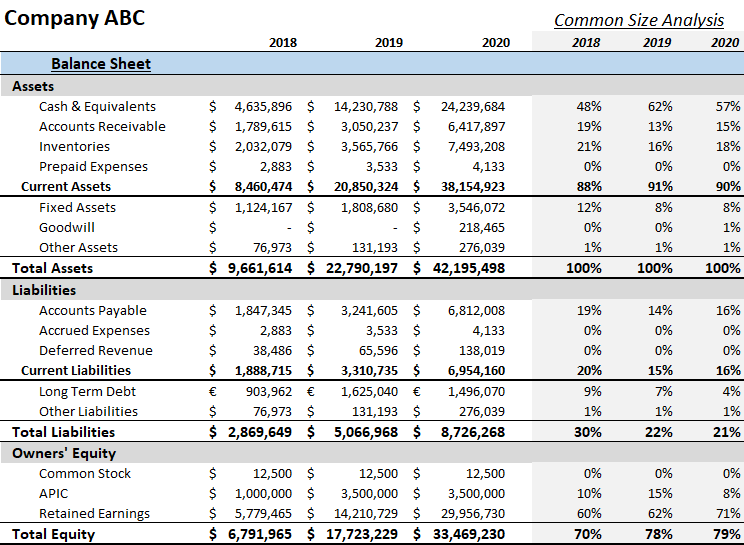
Source
The balance sheet provides a snapshot of the company's financial position at a specific point in time. It outlines what the company owns (assets), what it owes (liabilities), and the equity held by shareholders.
Key ratios, such as the current ratio and debt-to-equity ratio, assess liquidity and solvency, helping stakeholders determine if the company can meet short-term obligations.
Additionally, evaluating asset management through metrics like inventory turnover and accounts receivable days highlights operational efficiency and areas for improvement.
c. Cash Flow Statement Analysis

Source
The cash flow statement tracks the movement of cash in and out of the business over a specific period, categorized into operating, investing, and financing activities. While the income statement indicates profitability, the cash flow statement reveals liquidity, showing whether the company can sustain operations and invest in future opportunities.
Identifying trends in cash flow, such as seasonality or patterns affecting inflows and outflows, allows for effective cash management and financial planning.
3. Implementing Three-Way Modeling
Employ a three-way financial model that links the income statement, balance sheet, and cash flow statement.
For instance, if projected revenues increase, the three-way model shows how this affects net income on the income statement, changes in cash flow from operations, and the impact on working capital in the balance sheet.
This integrated approach allows for simultaneous updates, creating a comprehensive view of financial performance.
Furthermore, conducting scenario analysis helps assess the impact of various assumptions—such as a 5% increase in sales or a rise in material costs—enabling you to prepare for best-case and worst-case scenarios.
4. Creating Financial Forecasting Models
Create reliable financial by examining historical data and applying key drivers—such as accounts receivable turnover, days payable outstanding, and capital expenditure forecasts.
For example, if historical data indicates that accounts receivable typically spikes at year-end, this insight informs working capital forecasts for the upcoming period.
Revenue projections can be based on historical growth rates, market trends, and sales forecasts. For example, if you experienced consistent 10% revenue growth, projecting a similar growth rate for the next year is reasonable.
Similarly, estimating future expenses requires analyzing historical data while also considering anticipated changes, such as increased labor costs or new regulatory compliance expenses.
Developing rolling forecasts allows for dynamic financial planning that quickly responds to opportunities or challenges and is updated regularly, such as monthly or quarterly. These forecasts incorporate the latest data and adjust for market conditions and internal factors.
This approach also facilitates scenario planning, enabling the organization to model various outcomes based on different assumptions.
5. Conducting Sensitivity Analysis
Once the forecasting model is in place, sensitivity analysis involves varying key drivers, such as sales growth or cost increases, to understand how these changes impact profitability and cash flow.
For example, if you model a scenario where sales grow by 15% instead of 10%, you can see how this change affects net income, cash flow, and the organization's overall financial health.
Identifying which assumptions are most sensitive to change helps prioritize monitoring and make informed decisions.
6. Understanding Financial Ratios and Metrics
Derive various financial ratios from these statements, such as:
Profitability Ratios
Profitability ratios assess a company's ability to generate profit relative to its revenue, assets, or equity. Key ratios include:
- Gross Profit Margin = (Gross Profit / Revenue) x 100, which shows the percentage of revenue exceeding production costs.
- Net Profit Margin = (Net Income / Revenue) x 100, indicating how much of each dollar of revenue becomes net income.
- Return on Equity (ROE) = (Net Income / Shareholders' Equity), which measures profit generation from shareholders' investments.
Efficiency Ratios
Efficiency ratios evaluate how effectively a company uses its assets and manages its liabilities. Important ratios include:
- Inventory Turnover = (Cost of Goods Sold / Average Inventory), which shows how often inventory is sold and replaced.
- Accounts Receivable Turnover = (Net Credit Sales / Average Accounts Receivable), indicating how efficiently receivables are collected.
- Asset Turnover = (Revenue / Total Assets), measuring how well assets are used to generate revenue.
Liquidity Ratios
Liquidity ratios determine a company's ability to meet short-term obligations. Critical ratios are:
- Current Ratio = (Current Assets / Current Liabilities), showing the ability to cover short-term liabilities with short-term assets.
- Quick Ratio = (Current Assets - Inventory) / Current Liabilities, which excludes inventory to provide a stricter liquidity measure.
- Cash Ratio = (Cash and Cash Equivalents / Current Liabilities), revealing how much cash is available to pay short-term debt.
Solvency Ratios
Solvency ratios assess long-term financial stability and a company's ability to meet long-term obligations. Key ratios include:
- Debt-to-Equity Ratio = (Total Debt / Total Equity), showing the proportion of financing that comes from debt relative to equity.
- Interest Coverage Ratio = (EBIT / Interest Expenses), indicating how easily a company can cover its interest payments.
- Equity Ratio = (Total Equity / Total Assets), measuring the proportion of assets financed by shareholders.
Cash Ratios
Cash ratios focus on the company’s ability to generate cash flow for operations and growth. Key ratios include:
- Operating Cash Flow Ratio = (Operating Cash Flow / Current Liabilities), assessing how well cash flow from operations covers liabilities.
- Free Cash Flow = Operating Cash Flow - Capital Expenditures, showing the cash available after maintaining or expanding the asset base.
- Cash Flow Margin = (Operating Cash Flow / Revenue), which evaluates how efficiently revenue converts to cash.
These ratios provide deeper insights into financial performance, helping you identify strengths and weaknesses. Benchmarking these ratios against industry averages offers insights into competitive positioning.
For example, you calculate the return on equity (ROE) to gauge how effectively you generate profit from shareholders’ equity, let’s say 15%. If the industry average ROE is 20%, you will explore strategies to improve the efficiency or profitability.
7. Strategic Decision-Making
By translating financial insights into actionable strategies, you identify areas for improvement, such as cost reductions or new investment opportunities.
For instance, if analysis reveals that a specific product line is less profitable, management considers re-evaluating pricing strategies or discontinuing that product.
Aligning forecasts with strategic goals—whether expanding into new markets, launching new products, or optimizing operational efficiency—ensures that the organization remains focused on growth.
8. Communicating Financial Information
Rather than overwhelming the audience with data, focus on key metrics that resonate with their interests.
Each group has different priorities, so presenting tailored financial highlights ensures your communication is relevant and effective.
- Executives and board members: They are interested in high-level insights such as overall financial performance, long-term growth strategies, and return on investment (ROI). They focus on metrics like profitability, revenue growth, and strategic investments that drive future success.
- Investors and shareholders: They prioritize metrics that indicate the financial health of the company, such as earnings per share (EPS), dividends, and cash flow. They also look for signs of stable growth, liquidity, and financial stability, often asking about debt levels and projected returns.
- Department heads and managers: This group focuses on operational budgets, departmental spending, and cost management. They need to know how well their team performs against financial targets and where efficiency improvements can be made.
- Customers: They are primarily interested in how your financial performance affects them. They want to know that the company is financially stable and can continue delivering quality products or services. For example, financial strength could translate to better pricing or enhanced offerings.
- Employees: Employees are interested in financial stability from a job security standpoint. They also want to understand how well the company is doing in terms of profitability and growth, especially if bonuses or incentives are tied to financial performance.
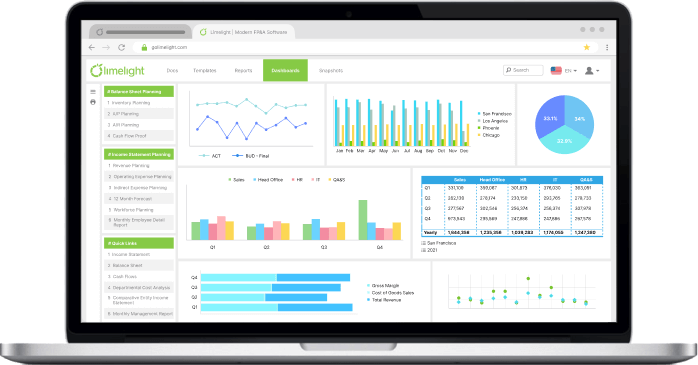
Further, designing visual dashboards makes complex financial data more digestible. They enable a quick overview, allowing decision-makers to assess trends and performance at a glance.
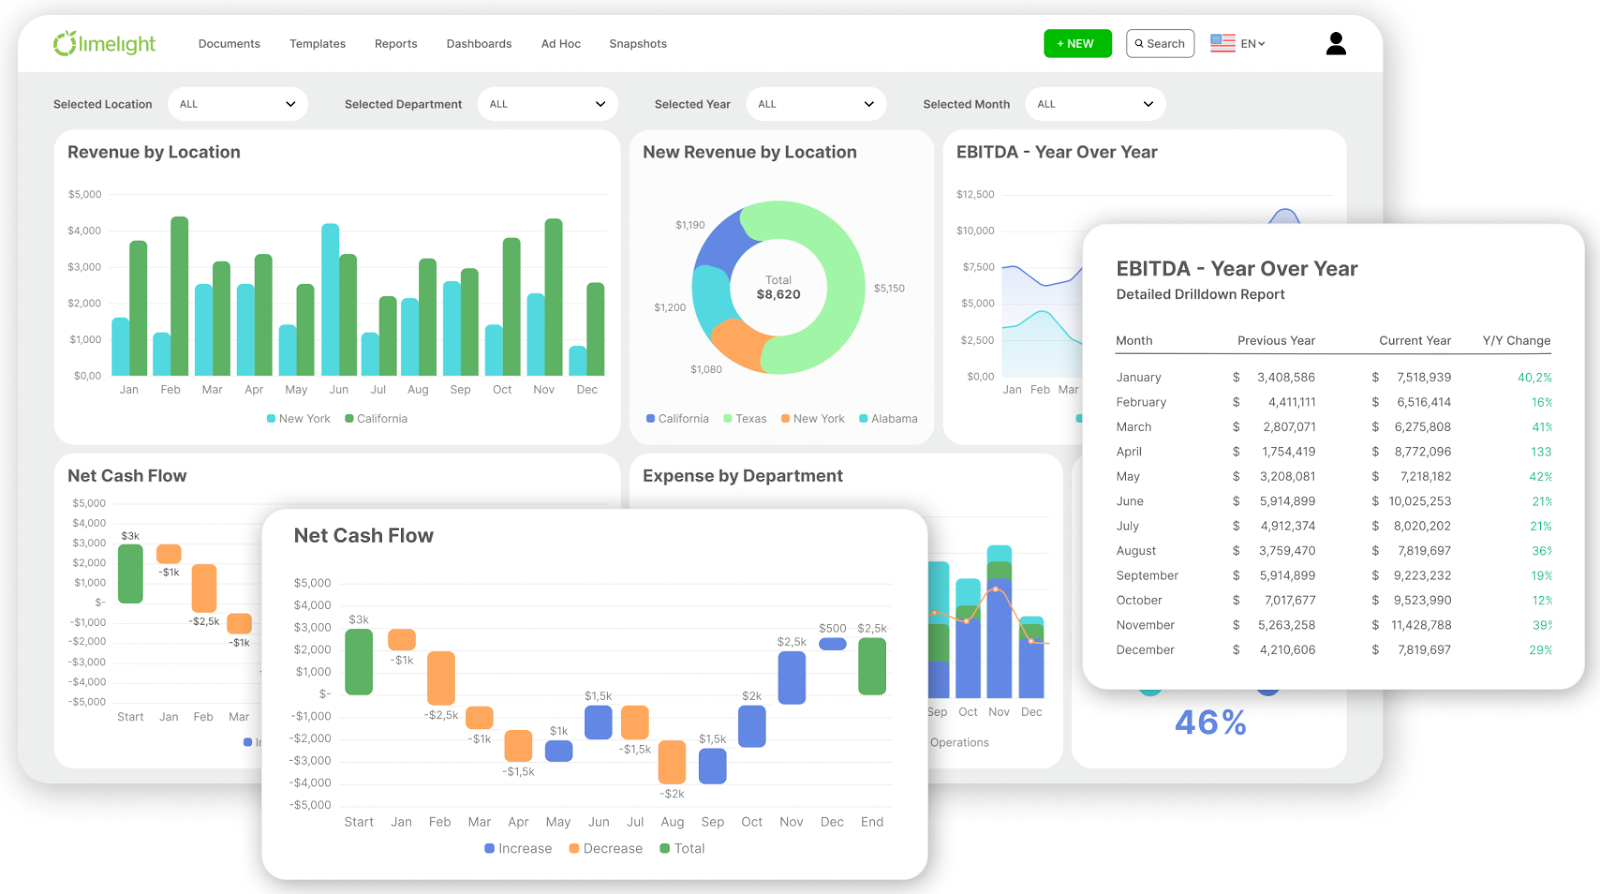
Limelight’s Interactive Reports
For instance, a bar chart comparing monthly revenue or a pie chart detailing the expense breakdown makes it easier for stakeholders to interpret the company's financial health.
So, whether you’re forecasting revenue or discussing budget allocations, make financial data relatable, actionable, and easy to understand.
What Are the Problems Encountered in Financial Statement Analysis?
Financial statement analysis helps understand a company’s financial health and make informed decisions, but it also presents several challenges that impact accuracy and effectiveness.
Here are some of the key problems faced:
1. Outdated or Incomplete Historical Datacash flow statement
While historical data is useful for identifying trends and projecting future performance, it can be misleading if not current. Financial statements reflect past performance, but business conditions change rapidly. Decisions based on outdated data lead to inaccurate forecasts and missed opportunities.
For instance, an unexpected market downturn or changes in customer demand will not be reflected in a company's financials from just a few months ago, creating a false sense of security.
2. Inconsistent Data Across Departments
In larger organizations, data comes from multiple departments, each using different systems and reporting standards.
For example, the sales team may report revenue differently from the finance department, leading to inconsistencies in the data used for financial analysis.
These inconsistencies skew the analysis and prevent stakeholders from accurately understanding the company’s performance.
Additionally, manual data reconciliation—especially when financial systems are not integrated—leads to delays, increases the risk of errors, and decreases the ability to respond to real-time business changes.
3. Limited Strategic Insights
Financial statements alone, while valuable, do not always provide deep strategic insights. Without the right analytical tools, companies find it difficult to move beyond basic metrics like profitability and liquidity to understand underlying drivers of business performance, such as customer acquisition costs or revenue by product line.
Another limitation of traditional financial statement analysis is the exclusion of non-financial metrics that significantly impact business outcomes. Factors like customer satisfaction, employee turnover, or operational efficiency are not captured in the balance sheet or income statement but can significantly influence long-term profitability and sustainability. Ignoring these qualitative aspects results in an incomplete analysis.
How You Can Make Financial Analysis Easier?
An FP&A tool — like Limelight — effectively addresses the challenges commonly encountered in financial statement analysis.
Limelight targets one of the major concerns — data integrity — by providing real-time data, allowing businesses to respond swiftly to changing market conditions. By centralizing financial information on a single platform, it eliminates inconsistencies across departments and creates a unified source of truth. This integration reduces the need for manual reconciliation, ensuring that all teams work with the same reliable data, which streamlines reporting and analysis.
Moreover, Limelight offers advanced analytics that extend beyond basic financial metrics. With features like scenario modeling, ad-hoc reporting, and the capability to drill down into specific areas, you gain deeper insights into key business drivers, enabling more strategic decision-making.
But why invest in an FP&A tool over spreadsheets?
Read our blog on why modern finance teams are choosing cloud FP&A over spreadsheets (Hint: It’s not just about saving time)

%20(1).svg)


.png?width=381&height=235&name=linkedinreal%20(27).png)