%20(1).svg)
What Is Management Reporting? A Guide for Finance Teams
By Laks Satchi |
Last Updated: July 09, 2026
Most finance teams spend far more time building management reports than analyzing what those reports reveal. If your month-end routine involves copying data from three ERPs into a dozen spreadsheets, reformatting columns, and emailing a PDF that leadership skims for five minutes, you already know the problem. The reporting process is eating the time your team needs for the work that actually moves the business forward.
Management reporting is the practice of collecting financial and operational data from across an organization and presenting it in a way that helps internal decision-makers, from department heads to the CFO to the board, monitor performance, identify risks, and decide what to do next. It is the bridge between raw numbers in your general ledger and the strategic conversations that determine where capital, headcount, and attention get allocated. According to Databox's survey of business leaders, 73.3% of managers say the most effective reports focus on what leadership needs to know, not just what data is available.
This guide breaks down management reporting the way a practitioner would explain it to a colleague: what it is, how it differs from financial reporting, the specific report types your finance team should be producing, and a step-by-step process for building reports that actually get read. Along the way, we will point to related resources and real-world applications so you can go deeper on the areas that matter most to your organization.
Management reporting is the structured process of gathering data from financial systems, operational databases, and departmental inputs, then analyzing and packaging that data into reports designed for internal consumption. The audience is always internal: CFOs, controllers, FP&A analysts, department heads, and board members. The purpose is always decision-making.
That last point is critical. A management report is not a data dump. It is a narrative built on numbers. As the Controllers Council emphasizes, the best management reports answer three questions: Where are we now? How does that compare to where we expected to be? And what should we do about it?
To make this concrete, here is what management reports typically contain:
 A well-designed management report consolidates KPIs, variances, and departmental performance into a single view that leadership can act on.
The defining characteristic of management reporting is flexibility. Unlike statutory financial statements that must conform to GAAP or IFRS standards, management reports can be tailored to whatever format, frequency, and level of detail the organization needs. A 50-person nonprofit tracking grant expenditures and a 3,000-employee SaaS company monitoring ARR by cohort will produce very different management reports, and that is exactly how it should be. For more on how standardized reporting frameworks can improve accuracy while preserving this flexibility, see our related guide.
This is the single most common point of confusion in corporate finance. Both types of reporting deal with numbers. Both live inside the finance function. But they serve fundamentally different purposes, and confusing them leads to reports that satisfy no one.
The table below lays out the differences side by side. Study it carefully, because the implications ripple through everything from report design to tool selection.
|
Dimension |
Management Reporting |
Financial Reporting |
|
Purpose |
Inform internal decision-making and strategic planning |
Demonstrate compliance and financial health to external parties |
|
Audience |
CFO, FP&A, department heads, board of directors |
Investors, creditors, regulators, tax authorities |
|
Required by law? |
No. Entirely voluntary and internally driven |
Yes. Mandated by GAAP, IFRS, SEC, and other regulatory bodies |
|
Time orientation |
Forward-looking: forecasts, projections, scenario analysis |
Backward-looking: historical performance over a defined period |
|
Format |
Flexible. Customized to the audience and decision at hand |
Standardized. Must follow prescribed formats and disclosures |
|
Frequency |
Daily, weekly, monthly, or on-demand as needed |
Quarterly and annually, per regulatory filing deadlines |
|
Level of detail |
Granular: by department, product line, geography, cost center |
Aggregated: consolidated entity-level statements |
|
Content scope |
Financial and operational data combined |
Primarily financial: income statement, balance sheet, cash flow |
In plain English: financial reporting tells external stakeholders where your company has been. Management reporting tells internal leaders where it is going and what to do about it. You need both. The challenge for most finance teams is that the tools and processes built for financial reporting, static spreadsheets, rigid chart-of-accounts structures, and quarterly close timelines, are poorly suited to the speed and flexibility that management reporting demands. That is why many organizations are moving to cloud-based FP&A platforms that handle both. For a deeper look at what is involved in financial reporting specifically, see our companion guide.
|
WHY THE DISTINCTION MATTERS When finance teams conflate management and financial reporting, two things typically happen. First, management reports become overly rigid, following the chart of accounts structure instead of being organized around the decisions leadership actually needs to make. Second, the reporting cycle gets locked to quarterly close timelines, which means leadership is always making decisions based on data that is weeks or months old. Separating the two workflows, while keeping them fed by the same underlying data source, is the foundation of a modern finance function. |
There is no universal taxonomy here. Management reports can be sliced a hundred different ways depending on the organization. But across the mid-marke
The budget vs. actuals report is the workhorse of management reporting. It compares what you planned to spend and earn against what actually happened, line by line, for a given period. The variance column (and the commentary explaining it) is where the real value lives. A 12% negative variance on travel and entertainment might be fine if a sales team is ramping in a new territory. The same variance in office supplies suggests a process problem. Context turns variance data into actionable intelligence. For organizations still running their annual budgeting process on spreadsheets, this report alone can consume days of manual consolidation each month.
This is especially true for teams using zero-based budgeting, where every line item was built from scratch - making the variance explanation more nuanced and the manual consolidation burden even heavier.
The consolidated P&L is a financial reporting artifact. For management reporting, you need to break it apart. A departmental P&L shows revenue, direct costs, and allocated overhead for each business unit, cost center, or location, giving leadership visibility into which parts of the organization are generating margin and which are consuming it.
This report is especially valuable for organizations with multiple locations or service lines. A healthcare system with six clinics needs to see margin by facility. A SaaS company with separate product lines needs to see contribution margin by product. The departmental P&L makes this possible.
Static annual budgets go stale the moment they are approved. Rolling forecasts solve this by continuously extending the planning horizon, typically 12 to 18 months forward, and updating projections each month as new actuals come in. The rolling forecast report shows where you expect to land based on current trajectory, not last November's assumptions.Those November assumptions are typically locked in during the AOP planning cycle and rolling forecasts exist precisely to keep the business from being anchored to them for twelve months.
According to CFO Dive, the shift from static budgets to rolling forecasts is one of the defining trends in modern FP&A. For a detailed look at how to implement this in your organization, see our guide on budget forecasting.

Rolling forecasts continuously update projections based on actual results, replacing the static annual budget with a living planning tool.
Revenue is an accounting concept. Cash is a survival metric. Cash flow projections estimate when money will actually arrive and when it will leave, giving leadership the visibility needed to manage working capital, time major expenditures, and avoid liquidity crunches. This report is especially critical for nonprofits (where grant funding arrives in unpredictable cycles), seasonal businesses, and any organization carrying significant accounts receivable.
Board reporting is the point where management reporting meets governance. A board pack distills the most critical information from all other management reports into a concise, high-level document designed for directors who are not involved in day-to-day operations. Boards increasingly expect more than a quarterly snapshot- which is why many finance teams now include 5 year forecasting alongside current-period results to show how today's performance connects to the longer-range plan.
The best board packs are 10 to 20 pages, visually driven, and structured around decisions the board needs to make rather than data the finance team happens to have.
A well-constructed board pack typically includes five elements:
A KPI scorecard strips away the narrative and presents a focused set of performance metrics in a traffic-light or threshold-based format. Green means on track. Yellow means watch closely. Red means take action. Scorecards are particularly useful for weekly management meetings where leadership needs a rapid pulse check without wading through a full management report.
Building a management report is not complicated in concept. It is complicated in execution, especially when data lives in multiple systems, stakeholders have conflicting needs, and the finance team is already stretched thin from close. Here is the step-by-step process that effective FP&A teams follow.
 A structured six-step process ensures management reports are purpose-driven and consistently valuable.
Before touching a spreadsheet, answer two questions: Who will read this report? And what decision will it help them make? A board pack for quarterly governance review requires a completely different structure, level of detail, and tone than a weekly KPI scorecard for the operations team. Starting with the end user prevents the most common management reporting mistake: building the report around the data you have instead of the decisions your audience needs to make.
Identify the five to ten metrics that directly connect to the strategic objectives this audience cares about. More is not better. A report with 40 KPIs is not a management report; it is a data catalog. For each KPI, document the source system (ERP, CRM, HRIS, project management tool) and the calculation methodology. This step eliminates the "where did you get that number?" conversations that derail review meetings.
This is where the process either scales or breaks. If your finance team is manually exporting CSV files from Sage Intacct, Oracle NetSuite, or Microsoft Dynamics and pasting them into Excel workbooks, consolidation will consume the majority of your reporting cycle. Cloud FP&A platforms like Limelight integrate directly with these ERPs, pulling actuals automatically and eliminating the manual export-paste-reconcile loop.
Lead with the executive summary. Follow with KPI performance. Then provide supporting detail by section (financial performance, operational metrics, strategic initiatives). Use charts for trend data, tables for variance analysis, and narrative text for context and recommendations. The goal is to make the report scannable in two minutes and deep-readable in ten.
Numbers without context are noise. Every significant variance, trend change, or risk flag should be accompanied by two to three sentences explaining what happened, why it matters, and what the recommended response is. This is what transforms a management report from a data printout to a strategic communication tool.
Set a cadence and stick to it. If the monthly management report lands on the third business day after close, leadership will plan around it. If it arrives "sometime in the second week," it will be deprioritized. After each cycle, ask your audience: What was useful? What was missing? What should we stop including? This feedback loop is how good management reports become great ones.
The step-by-step process above will get you a functional management report. The best practices below will make it genuinely useful.
We said this in Step 1 and we are saying it again because it is that important. According to Databox's research, nearly three-quarters of effective report builders focus on what leadership wants to know, not just what data is available. Before building or revising a management report, sit down with its primary audience and ask what keeps them up at night. Design the report to answer those questions directly.
A common trap is measuring what is easy to measure rather than what matters. Every KPI in a management report should trace back to a strategic objective. If your organization's top priority is improving net revenue retention, a KPI like "number of emails sent by marketing" does not belong in the management report, no matter how easy it is to pull from your CRM.
|
KPI SELECTION FRAMEWORK For each metric you consider including, ask: (1) Does this KPI connect to a stated strategic objective? (2) Can leadership take action based on this number? (3) Is the data source reliable and consistently available? If the answer to any of these is no, the metric does not belong in your management report. Reserve it for departmental operational reporting instead. |
Standardization does not mean rigidity. It means that every month's management report follows the same structure, uses the same KPI definitions, and arrives on the same schedule. This consistency builds trust. When leadership knows exactly where to find gross margin by department in the report, they stop asking the finance team to "just pull that number real quick." This is one of the core principles behind standardized financial reporting and it applies equally to management reports.
A well-chosen chart communicates a trend faster than a paragraph ever could. Use line charts for time-series data, waterfall charts for variance analysis, and heat maps for cross-departmental comparisons. But resist the temptation to over-design. The goal is clarity, not aesthetics. Every visualization should answer a specific question without requiring the reader to decode a legend or count gridlines.
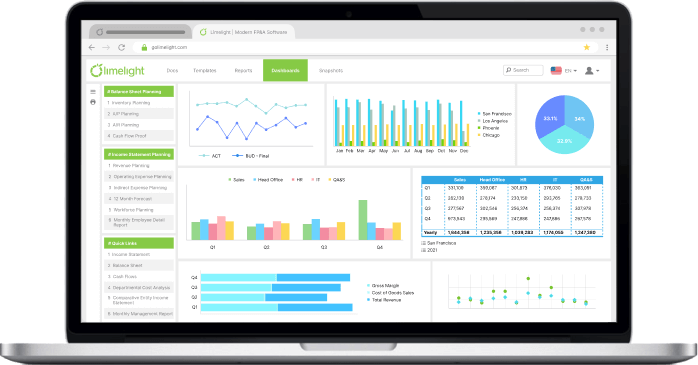
This is the single highest-impact improvement most mid-market finance teams can make. Manual data consolidation, the process of exporting data from ERPs, pasting it into spreadsheets, and reconciling across tabs, is where most reporting time is consumed and most errors are introduced. Cloud FP&A platforms like Limelight integrate directly with ERP systems (Sage Intacct, Oracle NetSuite, Sage 300, Microsoft Dynamics) and pull actuals in real time. Reports that used to take days to assemble can be generated automatically, freeing your team to focus on analysis and recommendations rather than data wrangling.
Limelight's OLAP-based analytical engine lets finance teams slice data across multiple dimensions (location, department, account, time period) without rebuilding reports from scratch each month. Reports can be exported to Excel while preserving formulas and calculations, so teams that need spreadsheet flexibility can have it without sacrificing data integrity. For a look at how these capabilities work in practice, watch the product demo.
Even well-intentioned management reporting processes can go sideways. Here are the five mistakes we see most frequently, and why they matter.
The shift from spreadsheet-based management reporting to purpose-built FP&A platforms is not about replacing Excel for the sake of modernization. It is about solving specific problems that spreadsheets cannot solve at scale. The top innovations in financial reporting over the past decade, from real-time data integration to OLAP-based multidimensional analysis, have fundamentally changed what is possible in management reporting.
Here is what modern management reporting software makes possible that spreadsheets cannot:
|
Capability |
Spreadsheets |
Cloud FP&A Platform |
|
Data consolidation |
Manual exports, copy-paste, reconciliation across tabs |
Automated, real-time data sync from ERP, CRM, and HRIS |
|
Version control |
Email attachments, naming conventions (Budget_v3_FINAL_v2) |
Single source of truth with audit trails and user-level permissions |
|
Multi-dimensional analysis |
Pivot tables limited by file size and RAM |
OLAP engine that slices data by location, department, account, and period instantly |
|
Report distribution |
Manually formatted PDFs emailed to a distribution list |
Automated, scheduled reports with role-based access and drill-down capability |
|
Collaboration |
Serial: one person works at a time, then emails it forward |
Concurrent: multiple users work simultaneously with change tracking |
|
Error risk |
High: broken links, overwritten formulas, circular references |
Low: governed calculations, validation rules, and controlled data inputs |
For mid-market organizations running on Sage Intacct, Oracle NetSuite, or Microsoft Dynamics, Limelight offers a purpose-built financial reporting and planning platform that connects directly to these systems. Finance teams can build board-ready reports, run ad-hoc analysis, and generate rolling forecasts without leaving the platform. For a complete list of reporting and planning tools across the market, see our guide to the best financial reporting software.
Management reporting is not a nice-to-have. It is the mechanism through which finance teams translate raw data into strategic action. The difference between organizations that use management reports effectively and those that treat them as a compliance exercise is not sophistication or budget. It is discipline: choosing the right metrics, designing reports for the audience instead of the data, maintaining a consistent cadence, and automating the parts of the process that machines handle better than humans.
If your team is still spending days each month assembling management reports in spreadsheets, the bottleneck is not your people. It is your process and your tools. Modern FP&A platforms eliminate the manual consolidation work, enforce data integrity, and free your team to focus on what they were hired to do: analyze, advise, and drive the business forward.

Financial reporting is mandatory, externally focused, backward-looking, and governed by GAAP or IFRS standards. Management reporting is voluntary, internally focused, forward-looking, and fully customizable to the organization's needs. Financial reports serve investors, creditors, and regulators. Management reports serve the people running the business day to day.
At minimum: an executive summary, KPI performance against targets, budget vs. actuals with variance commentary, departmental or segment-level performance data, forward-looking projections or forecasts, and actionable recommendations. The specific content should be driven by the audience and the decisions the report is designed to support.
Most organizations produce a comprehensive management report monthly, aligned with the financial close. KPI scorecards and cash flow reports may be generated weekly. Board packs are typically quarterly. The right cadence depends on the volatility of your business and how quickly leadership needs to respond to changing conditions.
Board reporting is the subset of management reporting designed specifically for the board of directors. It distills the most critical financial, operational, and strategic information into a concise package (typically 10 to 20 pages) that enables board members to fulfill their governance responsibilities. Effective board packs include an executive summary, financial performance overview, KPI dashboard, strategic initiative updates, and a risk summary.
Cloud-based FP&A platforms are purpose-built for management reporting automation. These tools integrate with ERP systems, automate data consolidation, and generate standardized reports on a scheduled cadence. Limelight, for example, connects with Sage Intacct, Oracle NetSuite, Sage 300, and Microsoft Dynamics to pull actuals in real time and produce board-ready reports without manual intervention. The key evaluation criteria when selecting a platform are ERP compatibility, report customization depth, multi-dimensional analysis capabilities, and ease of adoption for your finance team.
Management accounts are periodic (usually monthly) financial summaries prepared for internal use that include a profit and loss statement, balance sheet, and cash flow statement at a more granular level than statutory accounts. They often incorporate departmental breakdowns, budget comparisons, and commentary. Management accounts are essentially the financial backbone of the broader management reporting package.
Subscribe to our newsletter