%20(1).svg)
AOP Planning: The Complete Guide to Annual Operating Plans
By Aravind Swaminathan |
Last Updated: June 17, 2026
AOP planning is one of the most important responsibilities you have as a finance executive. It’s where targets, initiatives, and resources are translated into a roadmap that guides operations and decision-making across the organization.
Yet for many finance teams, the AOP planning process is fragmented, slow-moving, and resistant to change once set in motion. Too much time is spent collecting data instead of analyzing it. Forecasts are locked in early and rarely revisited.
And by the time the plan is finalized, market conditions may have already shifted. If your annual operating planning process feels reactive instead of strategic, this guide is for you.
We’ll explore where traditional planning breaks down, what to do instead, and how modern financial planning & analysis (FP&A) platforms can support you along the way. By the end, you’ll know exactly how to build a more effective, adaptable annual operating plan.
Let’s start with the basics.
The AOP is both a financial planning tool and a strategic roadmap.
It sets an organization’s financial and operational objectives for the fiscal year ahead. An effective annual operating plan (AOP) includes revenue growth goals, expense projections, headcount requirements, capital investments, and key performance indicators.
So, is an AOP the same as a budget?
Not quite—though they’re closely related and often developed in parallel. While the AOP sets the organization’s direction and priorities, the budget outlines the financial boundaries and funding allocations.
Here are five key differences between an AOP and a budget.
|
Aspect |
Annual Operating Plan (AOP) |
Budget |
|
Scope |
Broad; covers business objectives, key initiatives, and resource allocation |
Narrower; focuses solely on detailed cost and revenue estimates |
|
Development Flow |
Top-down and bottom-up; combines top-level initiatives with departmental input |
Typically, bottom-up, departments estimate needs based on historical data |
|
Time Horizon |
Full-year outlook with flexibility for mid-year updates |
Fixed 12-month view, typically locked at the start of the year |
|
Ownership |
Led by finance, with input from across the organization |
Owned by finance, developed in coordination with department heads |
|
Flexibility |
Designed to adapt with scenario planning and rolling forecasts |
Rigid; changes often require formal re-forecast or budget revision |
Let’s explore the essential building blocks of a modern, execution-ready AOP:
This provides a clear, consolidated view of the macroeconomic and business-specific factors underpinning the plan—such as market trends, inflation rates, hiring targets, and productivity benchmarks. An assumptions sheet helps minimize the risk of misaligned inputs or conflicting logic across departments.
This dynamic model links financial outputs with measurable operational levers, such as customer acquisition, average deal size, and capacity utilization. It enables finance teams to run scenarios, stress-test assumptions, and communicate results clearly to key stakeholders.
Execution starts with strategic plans owned by individual functions—such as product, HR, marketing, and sales. Departmental plans typically include functional KPIs, compensation assumptions, and team-specific dependencies to ensure accountability and alignment.
Accountability is essential to effective annual operating planning. A target and ownership matrix links key performance metrics to the business leaders responsible for them, making it clear who owns what and highlighting critical interdependencies.
This outlines the portfolio of major programs, projects, and investments that bring the strategy to life. It provides visibility into execution, enabling leadership to assess progress, allocate resources effectively, and make timely course corrections.
In volatile environments, fixed plans can quickly become outdated. Scenario planning adds flexibility to the AOP by preparing for upside, downside, and base-case outcomes—enabling faster, more confident decision-making as conditions change.
This connects the AOP to ongoing forecasting—whether monthly or quarterly—and includes mechanisms for rolling forecasts, actuals vs. plan reporting, and financial performance dashboards. It also forms the feedback loop that keeps all stakeholders informed and aligned.
The real value of an AOP isn’t just in the plan itself—it’s in what the plan enables. Here are the top benefits of having an annual operating plan:
AOP planning defines what your organization aims to achieve and allocates the resources needed to get there. It reduces ambiguity across teams and focuses execution on the outcomes that matter most.
Example: If projected sales revenue is expected to grow by 15%, the AOP ensures that marketing spend, hiring, and fulfillment capacity are all aligned to support that target.
When built on sound assumptions, AOP planning gives leadership an explainable, defensible plan. So when the board asks how Q3 revenue will be delivered, you can walk through pipeline volume, conversion assumptions, and regional expectations—with no guesswork.
Example: If a region is forecasted to contribute $10M in revenue, the AOP will connect that number to underlying assumptions—like number of reps, average deal size, and win rate—making it easier to justify and adjust if needed.
Market conditions shift. Product timelines change. A good annual operating plan evolves with them. It feeds into rolling forecasts, scenario models, and monthly reviews that keep the business on track. If conditions change mid-year, you can adjust targets and cost plans without starting from scratch—because your AOP planning is built to adapt.
Example: If a major product launch gets delayed by a quarter, the annual operating plan allows finance and product teams to quickly model the revenue impact, adjust marketing spend, and revise hiring plans—without redoing the entire plan from scratch.
Most finance teams know their AOP process could be stronger. The challenges are familiar: plans are often built in silos, where teams work independently with limited cross-functional alignment. Traditional spreadsheets dominate the workflow, making version control, data consolidation, and collaboration a headache. Assumptions are buried, not documented, and rarely challenged. And once the plan is set, it tends to become rigid—resistant to change even when conditions shift. The good news? There’s a clear path forward—and we’ve laid out the steps to help you build an annual operating plan that actually supports how your organization runs.
Before you build anything, you need to understand where last year’s plan broke—and why. That means looking beyond the results to the decisions that drove them.
Here’s what to do: segment by driver instead of relying on a generic variance report. Look at where pipeline conversion missed, where ramp assumptions failed, or where inventory turnover issues weren’t flagged early.
For instance:
Identify the three–five highest-impact variances that shaped EBITDA (earnings before interest, taxes, depreciation, and amortization) or free cash flow. Confirm whether they were structural issues or timing-related.
Next, debrief with function leads. Was the plan unrealistic? Was it ignored? Was execution the problem? Distill your findings into a one-page diagnostic you can use to recalibrate this year’s model. Share it before kickoff. Involve key stakeholders early in the AOP planning process.
Your targets are only as strong as the context behind them. Planning without an up-to-date view of the market and your execution capacity sets the stage for missed targets and reactive re-forecasting.
Start by building or commissioning a brief on external conditions—covering demand trends, competitor positioning, macroeconomic headwinds, pricing pressures, and shifts in buyer behavior. Don’t assume last year’s outlook still applies.
Then, assess internal constraints during AOP planning by asking:
Sit down with sales, operations, HR, and product leads for this exercise. These conversations often surface where friction is building—not just where headcount is short.
This is where prioritization happens. Before anyone touches a budget, you need alignment on what the organization is trying to achieve—including what’s non-negotiable. Without this, you end up with a wish list instead of a plan.
Start by setting three to five financial planning goals for the year. These should be specific, measurable, and time-bound. For instance, “grow revenue” isn’t enough—but “expand enterprise revenue by 20% through two new verticals” is.
Anchor each goal to the initiatives required to make it happen. Be clear about which team is responsible, what support they need, and when results are expected.
Here’s something to consider: if you’re launching in a new market, what won’t get funded? If margin expansion is a goal, what’s the cost takeout plan? If your team can’t articulate the tradeoffs, the initiative doesn’t belong in the annual operating plan.
Strategic goals only work if the resources are there to support them. Define the cost structure, required headcount, timeline, and expected ROI for each initiative. Then, build the budget around those inputs. You can use driver-based modeling to connect costs to operational realities.
For example, revenue should be based on pricing strategy, funnel conversion rates, usage assumptions, or other business drivers. Operating expenses should scale based on headcount, unit output, or territory coverage—not just top-line growth.
Let’s say your order volume is projected to increase by 20%. That means staffing and logistics costs should scale based on units shipped per warehouse associate or throughput per shift—not by adding 20% more headcount across the board.
Also, flag funding gaps early. If your annual operating plan includes expanding into a new region but the marketing budget won’t support pipeline development, don’t assume the gap will sort itself out midyear. If an initiative lacks the support it needs, either increase the investment, adjust the goal, or remove it from the plan.
AOP planning only works if it stays connected to business operations. Once it drifts from execution, it loses momentum. It also benefits from being paired with a longer-range view - 5 year forecasting gives the AOP its strategic anchor, so the annual plan isn't built in isolation from where the business needs to be three to five years out.
That’s why linking your annual operating plan with integrated business planning (IBP) and rolling forecasts is critical.
Use a shared model for both planning and forecasting. Profit margins, operating expenses, headcount, and other key metrics should run through the same logic, in the same system, using consistent assumptions.
For instance, if your organization plans to expand operations into a new region, that decision should be reflected consistently across your annual operating plan, resource allocations, and financial statements.
To build a truly responsive AOP model, eliminate system silos. Connecting tools like your CRM, HRIS, and ERP to an FP&A platform such as Limelight enables real-time data to flow directly into your planning process. This reduces lag and allows your model to adapt dynamically to hiring delays, demand shifts, or pricing changes.
A plan no one understands won’t get executed. Once the plan is finalized, your job shifts to communication and alignment. Start by translating high-level numbers into what each team needs to deliver. Outline the plan for hiring, marketing campaigns, delivery timelines, and product milestones.
For example, if marketing is expected to support a 15% increase in pipeline, define how many campaigns must run, in which regions, and by when.
Then, bring cross-functional teams together—sales, marketing, ops, HR, and product. Help them see where their plans overlap, where dependencies exist, and where priorities might conflict. The earlier you surface tensions, the faster you can resolve them.
Finally, set expectations around performance:
For instance, if revenue is off-track, is that a sales issue? If hiring lags, how will that affect downstream targets? Agree on which metrics trigger a review—and which team owns the response. Revisit the annual operating plan regularly in business reviews to stay aligned.
The value of any plan comes from how well it’s monitored, adjusted, and used to guide decisions. AOP is no different—it requires ongoing management.
Track both leading and lagging KPIs. If revenue underperforms, dig into the drivers: was it pipeline volume, pricing pressure, churn, or sales execution? If costs spike, was it due to hiring surges, vendor issues, or under-forecasted demand?
Make variance analysis part of your monthly review cycle:
These decisions should be pre-modeled—not made under pressure. Proper AOP planning ensures you're prepared for change.
When reporting to leadership, don’t just summarize actuals. Show how your plan supports operational efficiency, enables continuous planning, and drives a more data-informed approach to managing change.
Below are three key trends reshaping how finance teams approach the annual operating plan (AOP) process—and how you can prepare for each.
Only 22% of organizations can run a scenario analysis in under a day: a critical capability in volatile markets. Yet most teams still rely on fixed annual budgets that become obsolete at the first disruption, whether from supply chain issues, inflation, or demand shifts.
Therefore, building rolling forecasts into your rhythm is vital by adding a new quarter as one closes. Identify key triggers (e.g., pipeline drop, cost inflation, or evolving customer preferences) that prompt re-forecasting.
Equip your team with tools that allow them to run scenarios in hours, not days—and make that speed a performance KPI.
Almost 100% of FP&A professionals use spreadsheets for monthly planning and reporting, which slows them down, limits teamwork, and introduces version-control issues that delay planning cycles by weeks.
That’s where cloud-based FP&A platforms are helpful—they centralize models, connect operational and financial data, and enable real-time updates across functions.
Excel-free platforms like Limelight FP&A offer built-in workflows, real-time updates, and seamless system integrations—allowing finance teams to focus on strategic support instead of manual reconciliation.
Top-performing organizations no longer rely on blunt year-over-year estimates like “add 5%.” Instead, they forecast based on core business drivers—churn, win rates, production volume, and other operational levers that directly influence financial outcomes. These inputs are continuously tracked and updated as conditions change, creating forecasts that reflect real-time business dynamics.
To support this shift, around 85% of leading companies use a Center of Excellence (COE) to institutionalize forecasting best practices and ensure consistency, accuracy, and alignment across teams.
AOP planning is rarely perfect. But with the right framework, tools, and processes, it can drive smarter financial decisions and stronger execution across the business.
Limelight is a modern, cloud-based, Excel-free FP&A platform designed to help finance teams build, manage, and adapt their annual operating plans with confidence. For a deeper dive into managing the expense side of your plan, read our complete guide to OpEx Planning.
It provides full visibility into assumptions, business drivers, and performance across departments.
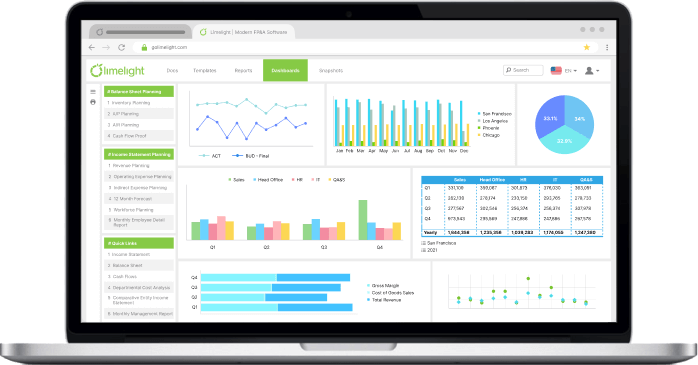
 Limelight’s FP&A software dashboard
Limelight transforms AOP planning by replacing fragmented spreadsheets and static models with a centralized, dynamic planning environment. This eliminates version-control issues, manual data merges, and siloed decision-making. Finance teams can leverage pre-built, best-practice templates to model expenses, revenue, and headcount, accelerating the AOP planning process and reducing the risk of errors.
With built-in support for rolling forecasts and multi-scenario planning, finance teams can easily update the annual operating plan as conditions change—without rebuilding templates from scratch. Model upside, downside, and what-if cases in minutes, not days. Driver-based planning and flexible modeling let you test assumptions and understand the impact of business decisions in real-time.
Limelight also includes integrated workforce planning to align hiring plans and personnel costs with business goals. It connects HR, payroll, and finance data to support accurate forecasting and more reliable resource planning.

Limelight’s workforce planning software dashboard
Finally, by integrating directly with your ERP and other systems, Limelight keeps plans synced with actuals—so forecasts and budgets always reflect the latest data.
Ready to modernize your AOP planning process? Book a demo with Limelight and see how you can plan faster, collaborate better, and execute with more agility.
While finance leads the process, ownership is shared across the organization. Here’s how it works: executive leadership sets direction and defines non-negotiables. Finance builds the framework, ensures consistency, and consolidates inputs. Department heads are accountable for their assumptions, targets, and resource needs.
Most organizations kick off the AOP planning in Q3, aiming to finalize the plan by late Q4. For many, the full cycle takes 8–12 weeks. Many are also moving toward anchoring on an annual plan, then updating it quarterly with rolling forecasts and scenario reviews. This allows them to stay in sync with the long-term strategy while adapting quickly as conditions change.
Subscribe to our newsletter