
%20(1).svg)

By Limelight Team |
Last Updated: September 01, 2026

Nonprofit finance teams are forecasting growth into conditions that have already disrupted a third of the sector. The Urban Institute’s 2025 National Survey of Nonprofit Trends and Impacts surveyed 2,737 organizations. In the first four to six months of 2025, 21% lost at least some government funding, 27% saw a delay, pause, or freeze, and 6% received a stop work order. Over the same period, BDO’s 2025 Nonprofit Standards benchmarking survey found 86% of nonprofits reporting revenue growth in their most recent fiscal year, and 90% expecting it to continue.
Both findings can be true at once. Awards signed in a prior year fund a current year, and the gap between a policy decision and its arrival in your bank account runs to several quarters. The plans built on that lag are the ones that break.
Most finance leaders reading this have already run a scenario planning exercise. The problem is rarely that it was never done. It is that the output was a document, the assumptions moved, and by the time a funder actually pulled back, the file no longer described the organization. What follows is a method for building scenarios that stay current, in six steps, ordered by dependency.
Forecasting asks what is most likely to happen. Scenario planning asks what the organization would do across a range of outcomes, and commits to those responses in advance. The output is not a number. It is a set of decisions that have already been made, attached to conditions that will tell you when to act on them.
That distinction gets lost when scenarios are built as alternate budgets. A static budget with three variants is still three static budgets, each one aging from the moment it is saved. The exercise produces a deliverable that satisfies the board, and eight months later nobody can say whether the worst case still reflects the current award pipeline.
The failure is one of shelf life rather than effort. Everything below is organized around keeping the work usable past the week it was completed.
Commercial scenarios usually model demand falling. A nonprofit scenario models a funding relationship changing, and the two behave differently because a portion of nonprofit revenue arrives with obligations attached to it.
Consider two organizations, each losing $500,000 against the plan. The first loses a restricted program grant. The revenue disappears, and so does most of the associated program cost, because the activity it funded stops with it. The second loses unrestricted revenue, perhaps a major donor or an earned-income line. The revenue disappears and the expense base stays exactly where it was.
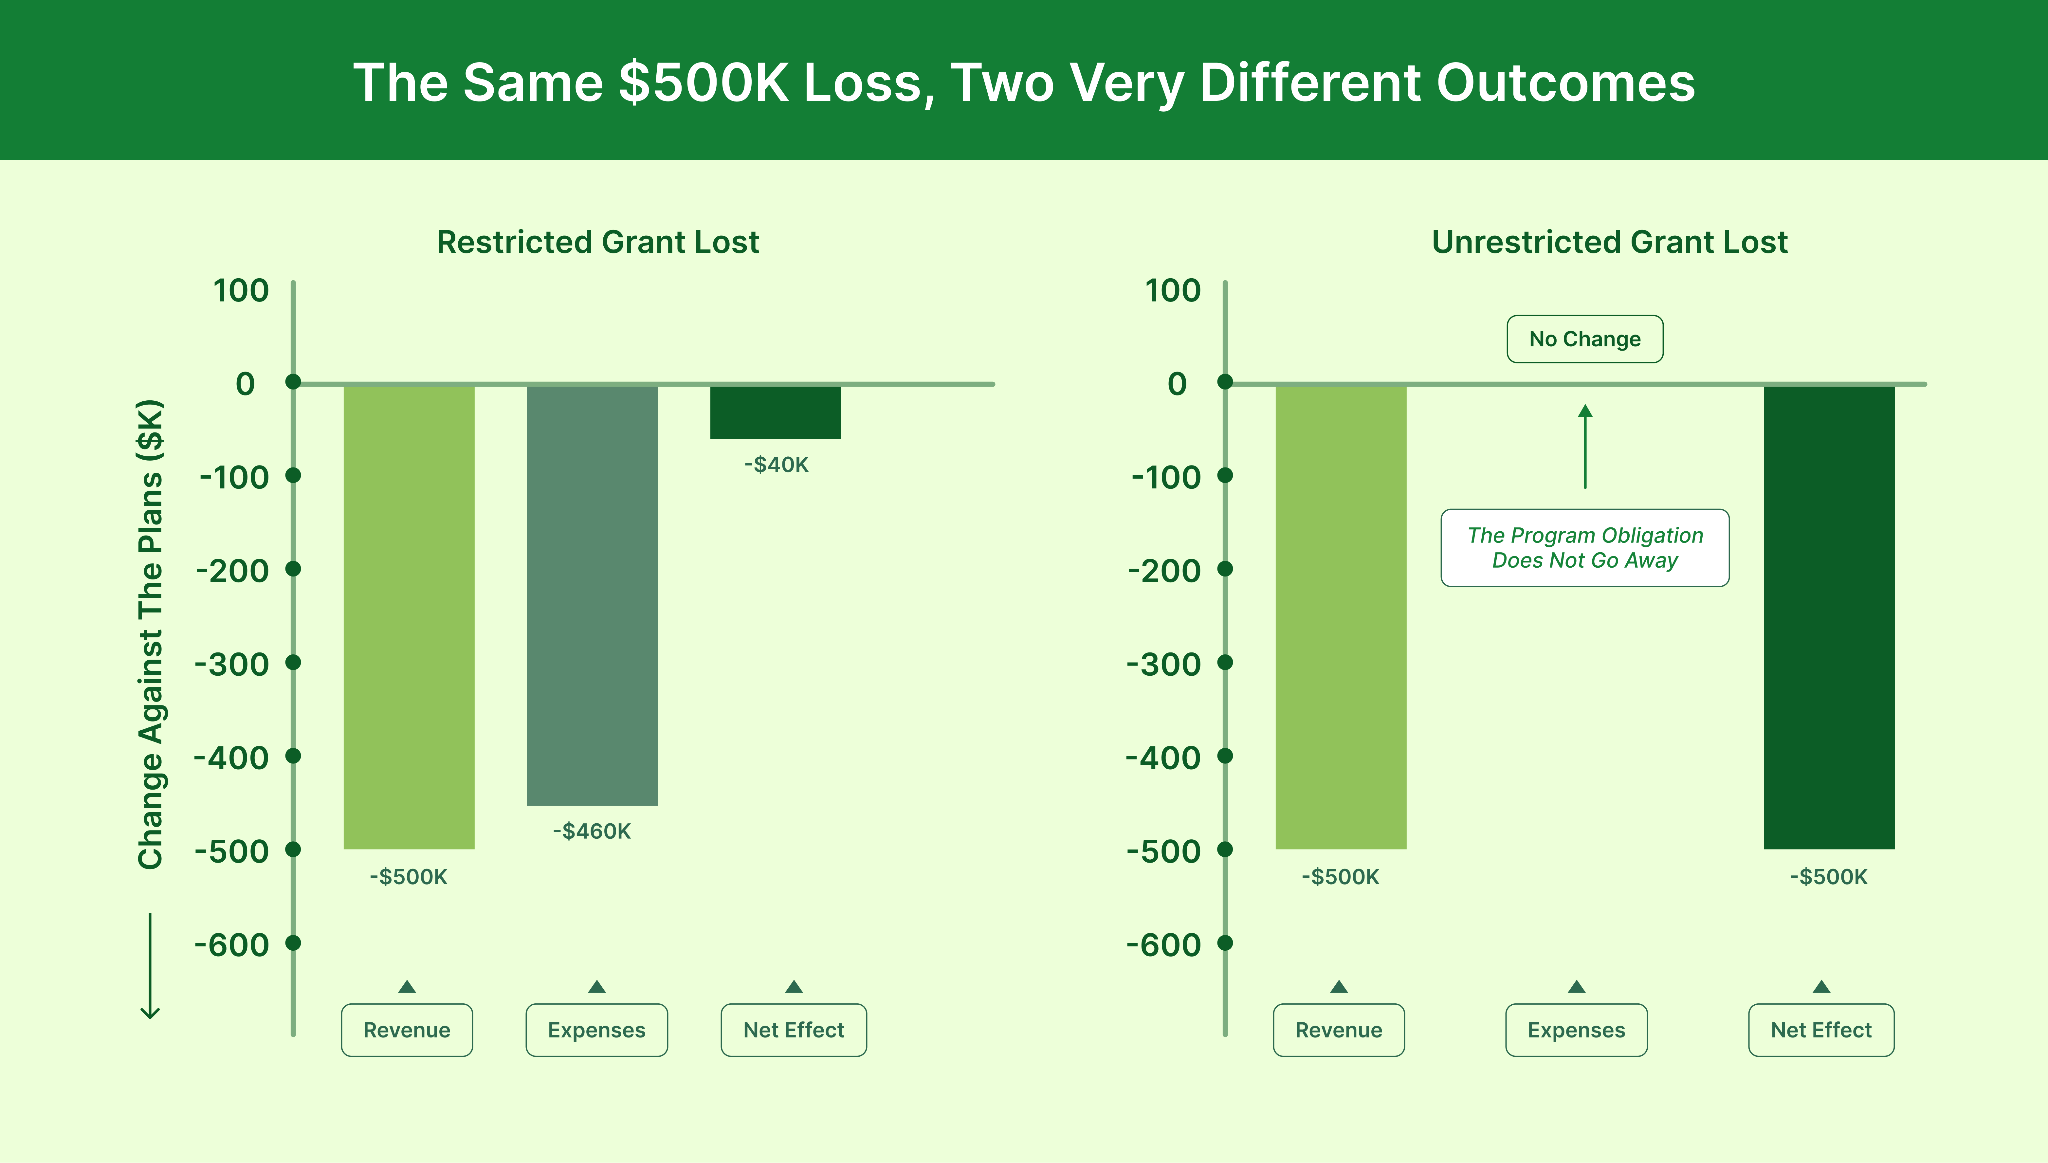
Ranking scenarios by the size of the revenue loss therefore gets the order wrong. The threat worth modeling first is usually the unrestricted one, even when the dollar figure is smaller.
Three further constraints shape how a funding change moves through the plan.
Those constraints also determine how a funding change shows up in the financial statements, which is what makes the modeling worth doing carefully. The first decision is which changes to model at all.
Best case, base case, and worst case is the default set, and it is weak for a specific reason: the labels describe sentiment rather than events. Nobody can act on a worst case, because no one can say what happened in it.
Name the event instead. "State contract not renewed in July." "Federal pass-through reduced 30% at the next award cycle." "Two largest individual donors lapse in the same year." Each of these implies a different response, which is the test of whether a scenario earns a place in the set.
Spacing matters as much as naming. Scenarios clustered within a few percentage points of each other produce three versions of the same decision, which is wasted modeling effort. Each scenario should sit far enough from the next that it activates a different tier of response.
|
THE THREE-SCENARIO TEST. Before modeling anything, write one sentence describing what you would do in each scenario. If two of those sentences are the same, you have two scenarios, not three. If you cannot write the sentence at all, the scenario is not specific enough to model yet. |
Three is the practical ceiling. A fourth rarely changes a decision, and it doubles the reconciliation work every time the annual budget is revised. What makes that reconciliation manageable is how the scenarios are built.
The most common way to build a scenario is to copy the budget file and edit it. That approach works exactly once. As soon as actuals come in and the base plan is revised, the copies are stale, and no one has time to apply the same revision three times.
The alternative is to hold one base plan and express each scenario as a change to named drivers. Award value, headcount by program, and reimbursement timing carry most of the movement for a typical nonprofit. When the base plan updates, every scenario updates with it.
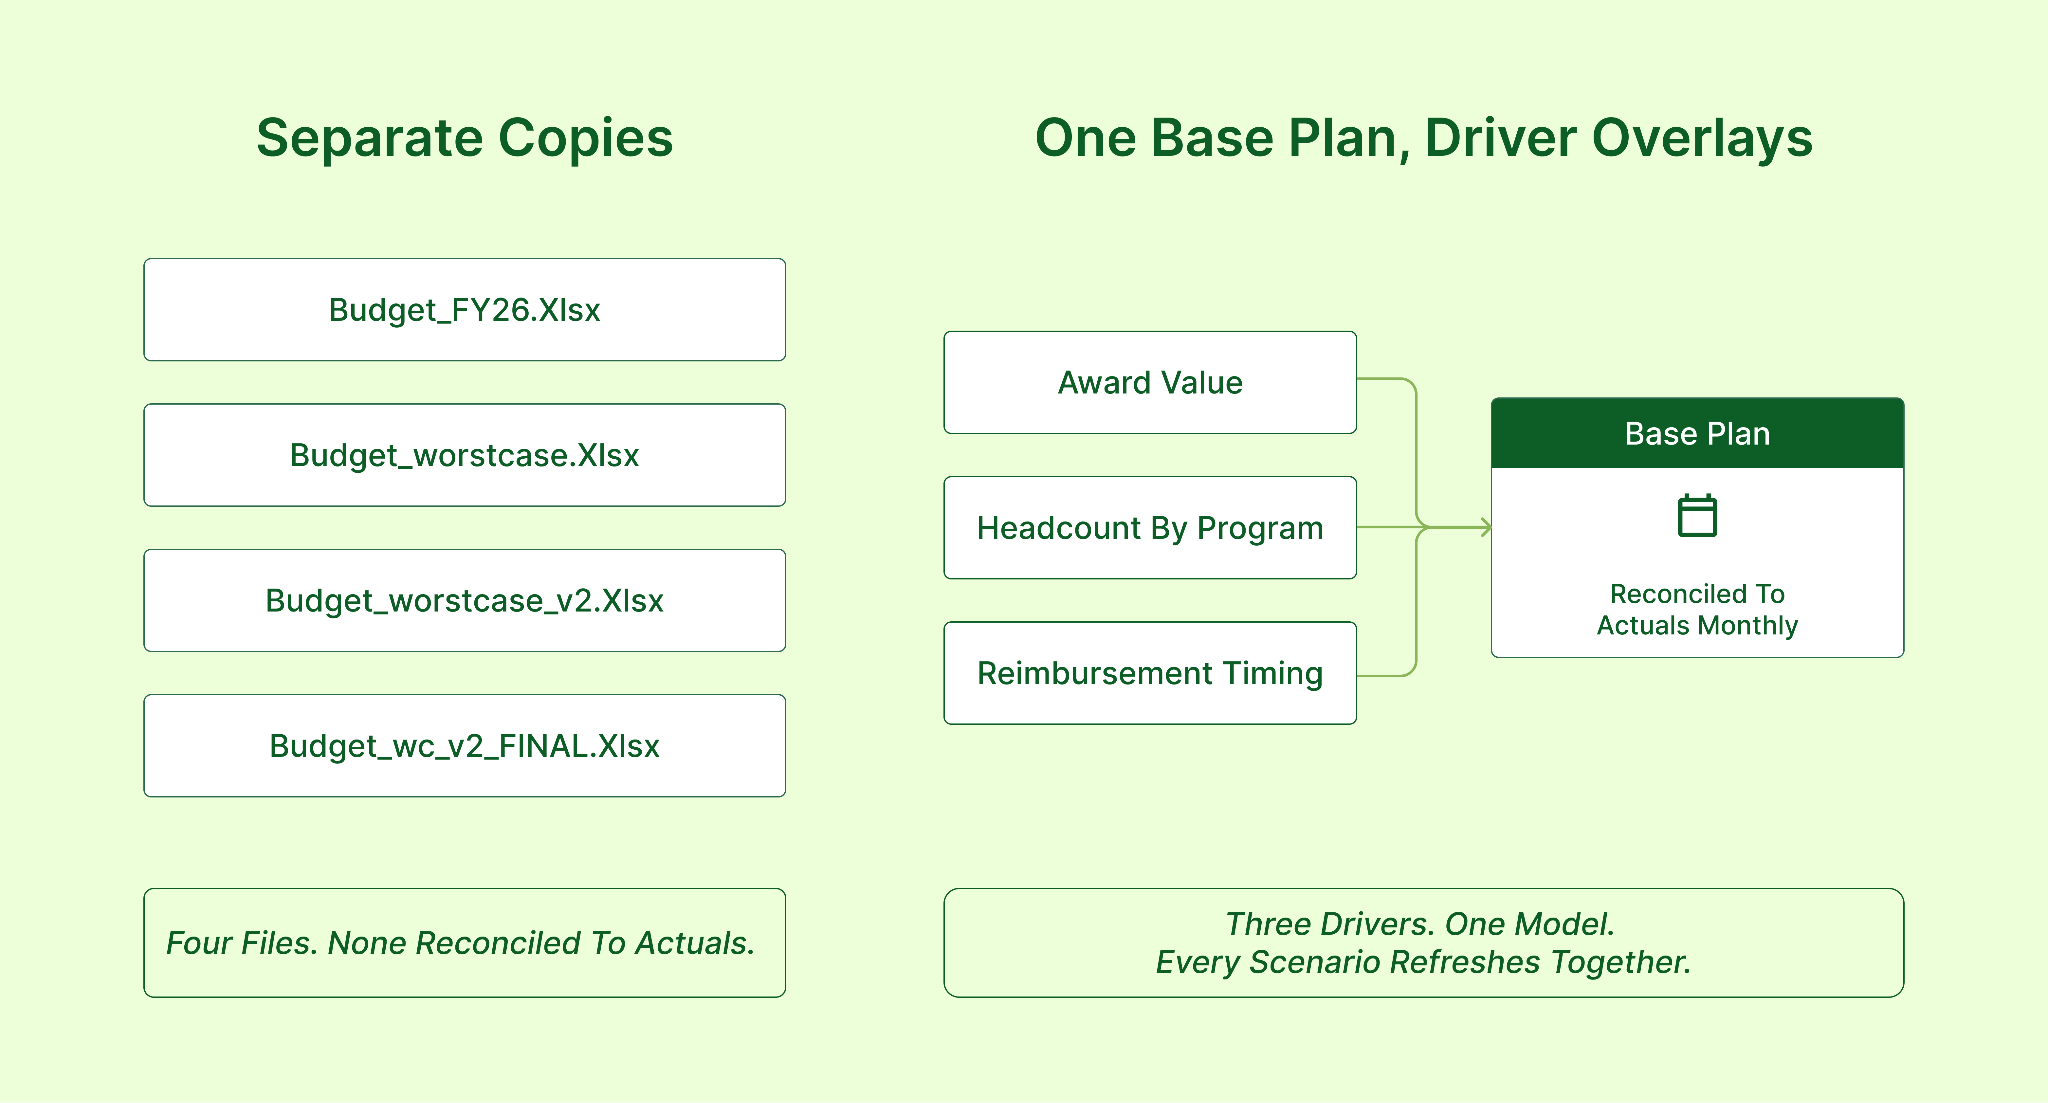
This is the same structure behind driver-based planning generally, applied to a narrower question. The nonprofit-specific part is choosing drivers that map to how funders actually behave, which usually means holding assumptions at the award level rather than in aggregate.
Connecticut Green Bank built its planning around operational drivers specific to its programs, including solar production, and consolidated roughly thirty separate reports along the way. Jane Murphy, VP of Finance and Administration, has described the change as moving the team from assembling numbers to interpreting them. The account of that implementation is a useful reference if your own drivers are similarly program-specific.
Driver structure fixes how scenarios are maintained. It does not by itself show you what the scenario means, and that depends on where the model is aggregated.
Consolidated views answer whether the organization survives a funding change. It rarely answers what to do about it, because the decision is almost never organization-wide.
Take a 12% consolidated revenue decline. Spread evenly, it looks like a manageable trim. Traced to programs, it might mean one program has lost 60% of its funding and no longer covers its own direct costs, while the rest of the organization is untouched. Those are opposite conclusions from the same headline number, and only one of them is actionable.
|
Program A |
Program B |
Consolidated |
|
|---|---|---|---|
|
Revenue in plan |
$2.4M |
$1.9M |
$4.3M |
|
Revenue in scenario |
$2.3M |
$1.4M |
$3.7M |
|
Change |
Down 4% |
Down 26% |
Down 14% |
|
Direct costs |
$1.8M |
$1.5M |
$3.3M |
|
Contribution after direct costs |
$500K |
Negative $100K |
$400K |
|
What it implies |
Continue as planned |
Restructure or wind down |
Nothing specific |
Program B is the decision, and it is invisible in the consolidated column. Modeling at this level requires that shared costs are allocated consistently, which is where the exercise usually stalls. Getting operating expense allocation settled before scenario work begins saves rebuilding the model halfway through.
Once you can see which program breaks, the question becomes what you would actually do about it, and how quickly that action produces cash.
Most contingency plans list responses without ordering them. The ordering is the useful part, because responses differ enormously in how long they take to produce cash, and the largest levers are almost always the slowest.
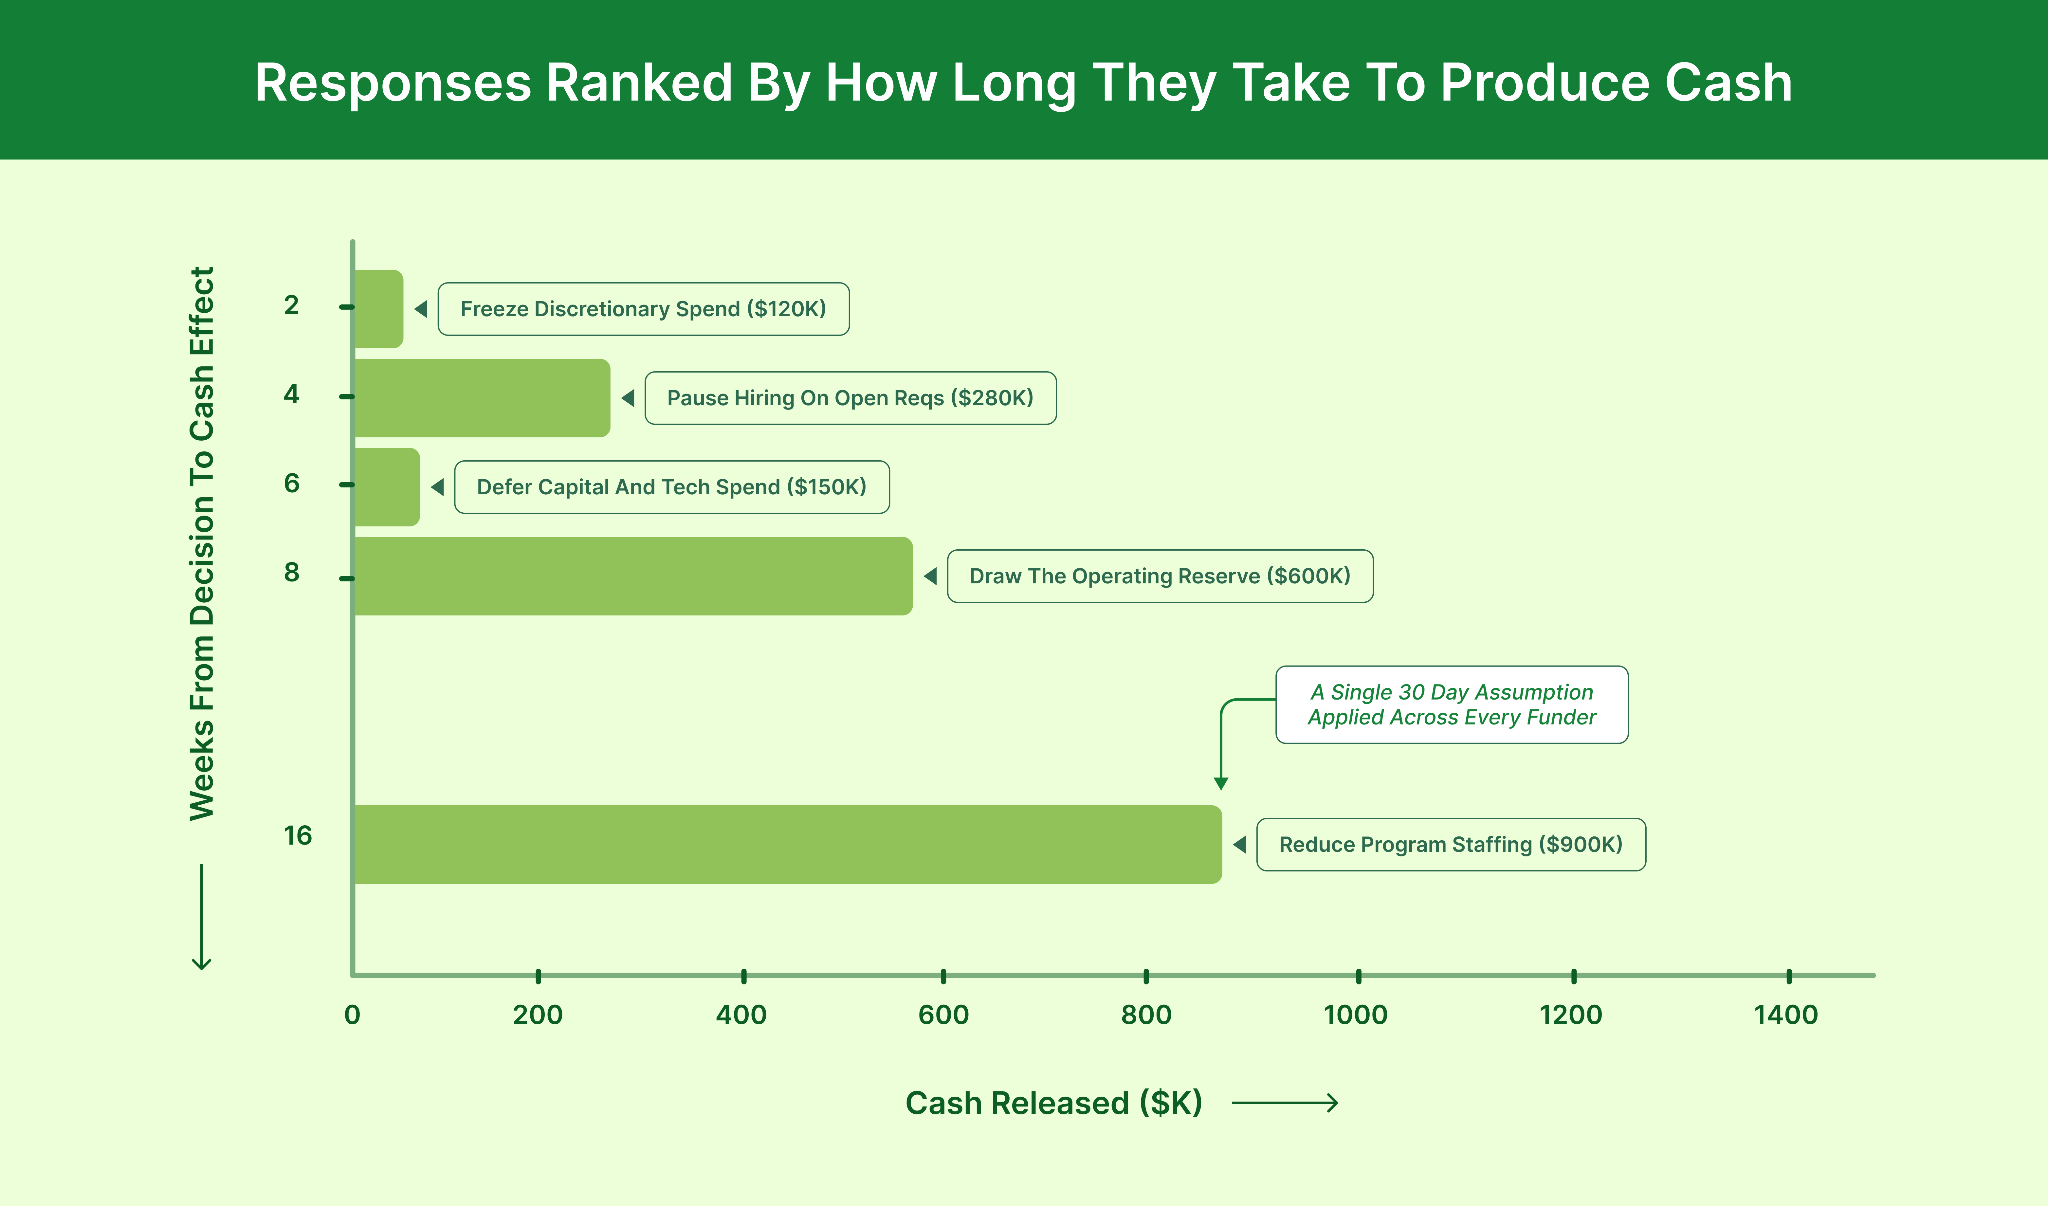
Reading the ladder from the bottom up changes the timing of decisions. If a staffing reduction takes sixteen weeks to produce cash and the projected shortfall arrives in twelve, the decision had to be made a month before anyone noticed the problem. That is the argument for triggers, and it is the reason the ladder is built in advance rather than during the shortfall.
Each tier needs three things recorded against it.
Staffing tiers deserve particular care, since the cash effect depends on notice periods, accrued leave payouts, and whether the roles are grant-funded. Modeling them properly is closer to workforce planning than to expense budgeting, and treating them as a simple salary line will overstate the savings and understate the delay.
Triggers written into a scenario document depend on somebody remembering to check them. Eight months into a fiscal year, with the document saved in a shared drive nobody has opened since the planning session, that is not a control.
Built into the monthly reporting pack, a trigger fires whether or not anyone remembers. The reporting pack gets produced regardless, so the threshold check comes along with it at no additional cost.
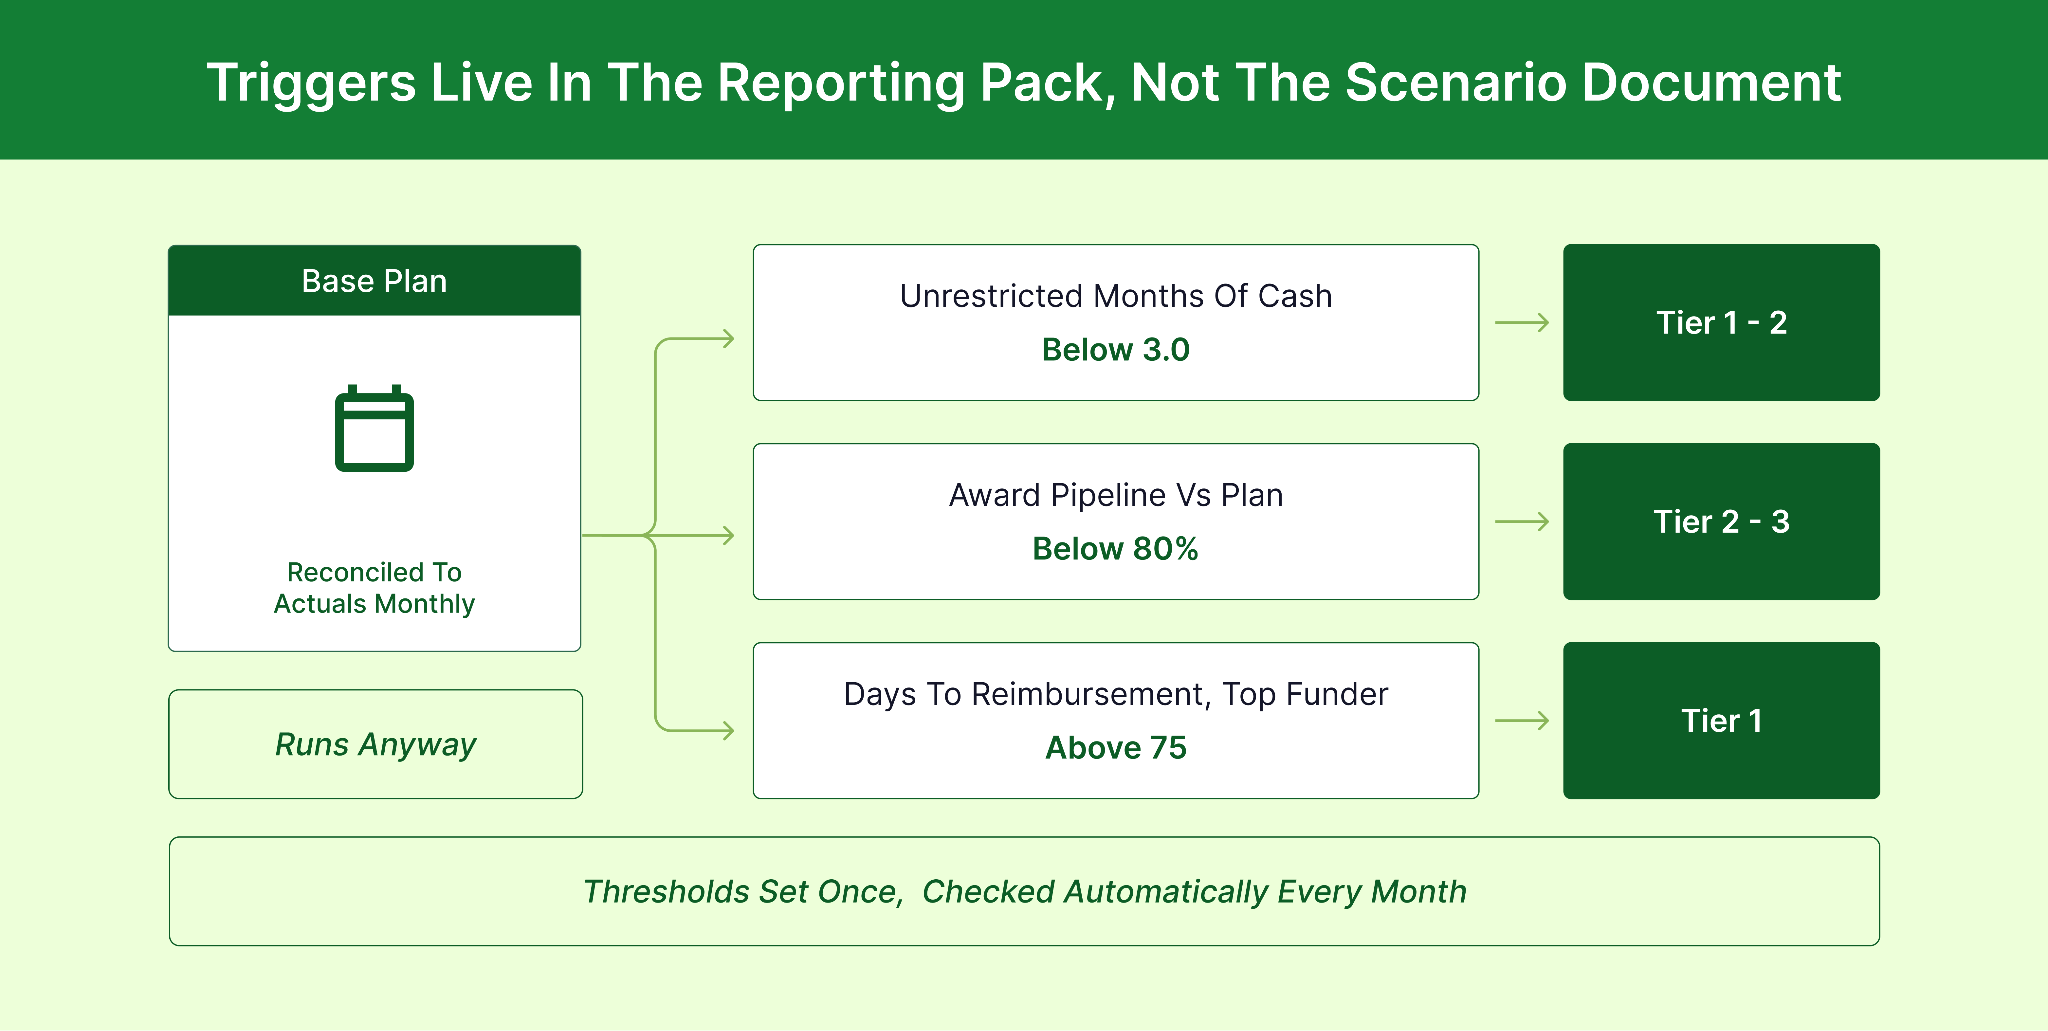
Choosing thresholds is a judgment call, and the useful ones share two properties. They are calculable from data the organization already produces, and they move early enough to leave the slowest tier some room. A metric that turns only after the shortfall has arrived is a report, not a trigger.
|
Candidate metric |
Why it moves early |
Watch out |
|---|---|---|
|
Unrestricted months of cash |
Reflects funding changes before they reach the income statement |
Must exclude donor-restricted balances or it will read as comfortable while liquidity tightens |
|
Award pipeline against plan |
Renewal decisions land months before the funding stops |
Requires that pipeline stages are recorded consistently, which is often a fundraising process gap |
|
Days to reimbursement, largest funder |
Payment behavior deteriorates before a formal funding change is announced |
Noisy month to month; use a three-month rolling average |
|
Program contribution margin |
Shows which program is drifting toward the restructure decision |
Only meaningful once shared cost allocation is stable |
Where these surfaces matter as much as which ones you pick. Thresholds buried in a monthly appendix get skipped; the same figures on the front page of a standing finance dashboard get read. Organizations that maintain live reporting views generally find the trigger check costs nothing to run once it is configured.
Scenarios go stale in a predictable order. Triggers drift first, because the underlying metrics move monthly. Assumptions drift next, as awards are won, lost, or repriced. The scenario set itself lasts longest, since the shape of the organization changes slowly.
Matching each refresh interval to that order keeps the work proportionate.
|
Interval |
What gets updated |
Effort |
|---|---|---|
|
Monthly |
Trigger thresholds, read as part of the close |
Minutes. No modeling, just the threshold check |
|
Quarterly |
Driver assumptions against actuals and the current award pipeline; confirmation that response ladder figures still hold |
Half a day |
|
Annually |
The scenario set itself. Last year’s largest threat is frequently no longer the relevant one |
Rebuild, alongside the budget cycle |
The quarterly step is the one that lapses first and the one that keeps the model honest. Organizations already running rolling forecasts can usually fold it into an existing cycle rather than adding a new one, and a rolling forecast structure gives the scenarios somewhere to sit.
Models that refresh on schedule are defensible. Presenting it is a separate problem, and one that finance teams tend to underestimate.
Presented without framing, a worst case reads as a prediction. Boards respond to predictions, sometimes by making decisions the model was built to defer, which is the opposite of what the exercise is for.
The framing that works is explicit about the difference. A forecast is what you expect. A scenario is what you have prepared for. Saying so directly, before the numbers appear, changes how the room hears them.
Splitting the material into two layers also helps.
Distributed input tends to improve both layers. Communication Service for the Deaf cut its budget cycle in half after program leads began contributing directly rather than returning spreadsheets to finance. Ben Daniel, Director of FP&A, has pointed to that shift as the change that mattered. Scenario work benefits the same way, since program leads are the people who know what a 26% funding reduction does to delivery. The CSD implementation and the broader question of what belongs in board reporting are both worth reviewing before the first scenario presentation.
The failures are consistent across organizations, and none of them are analytical. They are structural choices made early that quietly limit what the model can tell you later.
|
Failure |
How it shows up |
The correction |
|---|---|---|
|
Sentiment labels instead of events |
Nobody can say what happened in the worst case, so nobody can act on it |
Name the funder, the program, and the timing |
|
Scenarios spaced too narrowly |
Three versions of the same decision |
Space each scenario to activate a different response tier |
|
Separate budget copies |
Scenarios stop matching the base plan within a quarter |
One base plan, scenarios as driver overlays |
|
Consolidated-only modeling |
The organization looks fine while one program is unviable |
Model to program contribution after direct costs |
|
Triggers in the document |
Thresholds are crossed and nobody notices for months |
Put thresholds in the monthly reporting pack |
|
Response tiers without lead times |
The right decision gets made too late to produce cash in time |
Record lead time and authorization path per tier |
Each of these traces back to treating scenario planning as an event rather than as part of the ongoing financial planning cycle. Where the scenarios live inside that cycle, the corrections mostly happen on their own.
None of the six steps require software. They require a model that stays reconciled to the general ledger while carrying several scenario variants, which is where spreadsheets tend to give out once an organization runs multiple funds across several awards.
Limelight holds scenarios against a single planning model rather than as separate files, with fund and program dimensions imported from Sage Intacct, NetSuite, Microsoft Dynamics, or Blackbaud and preserved through planning and reporting. Fund accounting stays in the accounting system. What changes is that the program-level view in Step 3 comes from dimensions the accounting system already maintains, rather than from a mapping someone rebuilds each quarter.
Three of the six steps lean on that connection more than the rest.
For an organization with one accounting system, two awards, and a stable program structure, a well-maintained spreadsheet will carry this work for some time. The reconciliation problem shows up as fund and program complexity grows, which is when the nonprofit planning use case becomes worth evaluating properly.
If your organization already has a scenario plan, the fastest improvement is not to rebuild it. It is to take the two or three conditions buried in that document, set explicit thresholds against them, and put them into next month’s reporting pack.
That single change converts a filed document into something that can interrupt you. The driver restructuring, the program-level modeling, and the response ladder all make the model better, and they can follow over a quarter or two.
What changes once the triggers are live is when the conversation happens. A funding problem surfaces while the slower responses are still available, which is generally the difference between choosing a course of action and accepting the one that remains.
|
MODEL FUNDING CHANGES WITHOUT REBUILDING THE PLAN. Limelight holds scenarios against one model, with fund and program dimensions imported from your accounting system. Book a demo to see how it handles scenario comparison and trigger reporting for nonprofit finance teams. |
It is the practice of modeling specific funding events, deciding responses in advance, and setting thresholds that signal when to act. It differs from forecasting, which projects the single most likely outcome.
Three is the working number: a base plan and two named alternatives. A fourth rarely changes any decision and multiplies the work of keeping every version reconciled to actuals.
Usually not. Losing a restricted grant removes the associated program obligation along with the revenue. Losing unrestricted revenue leaves the full expense base in place, producing a larger deficit from a smaller loss.
Check trigger thresholds monthly with the close, update driver assumptions quarterly against actuals and the award pipeline, and rebuild the scenario set annually to confirm the named events still matter.
Named funding events rather than sentiment labels, driver assumptions per scenario, program-level contribution, an ordered response ladder with lead times, and trigger thresholds instrumented in monthly reporting.
Yes, for a small number of funds and awards. It breaks down when scenario copies stop reconciling to the base plan. This comparison of scenario planning tools covers the alternatives, and this general guide to scenario planning covers the method outside a nonprofit context.
Subscribe to our newsletter