
%20(1).svg)
Financial Planning & Analysis
Vertical Analysis in Financial Planning: Meaning, Importance & Process
By Anran Xie |
Last Updated: June 17, 2026

According to the 2024 Global Finance Trends Survey, 69% of finance leaders recognize the critical role of financial planning and profitability analysis in strategic decision-making. Interpreting financial data, especially complex datasets, can pose challenges, even for seasoned professionals.
Vertical analysis is a vital tool used by CFOs, Finance Directors, Financial Controllers, and VPs of Finance. They use it to express financial statement line items as percentages of a base figure, providing insight into financial relationships. This method is essential for evaluating a company’s financial health and operational efficiency.
In this article, we explore the application of vertical analysis, including its practical uses and how it integrates into broader financial planning and analysis (FP&A) frameworks.
According to a recent report by the Corporate Finance Institute, AI-driven tools have significantly improved the efficiency and accuracy of vertical analysis. Thus, vertical analysis is a financial analysis technique where each item in a financial statement is expressed as a percentage of a base figure. This allows standardized comparisons across periods or between companies of varying sizes.
Vertical analysis remains essential for investors, managers, and finance professionals who need a clear snapshot of a company’s financial structure. It supports informed resource allocation and strategic decision-making by providing transparency into cost structures.
Unlike horizontal analysis, which evaluates changes in financial data over time, vertical analysis focuses on each line item’s relationship to a base figure within the same period. Using both approaches together offers a more comprehensive perspective, helping finance professionals identify trends, assess cost structures, and make informed decisions.
Vertical analysis is essential in financial management, providing finance leaders with actionable insights. Below are three key reasons why it is critical for driving effective financial strategies:
Vertical analysis can be applied to different financial statements:
Each type of vertical analysis uses a different base figure, depending on the statement, allowing stakeholders a detailed view of financial positioning.
|
Financial Statement |
Base Figure for Vertical Analysis |
|
Income Statement |
Total Revenue |
|
Balance Sheet |
Total Assets |
This method remains a fundamental tool for understanding and communicating the financial health of a business, providing actionable insights for ongoing financial planning.
In a vertical income statement analysis, total revenue is the base figure. Each line item—cost of goods sold (COGS) and operating expenses—is a percentage of total revenue. This method provides a clear view of profit margins and expense ratios, allowing for straightforward comparison across periods or with industry benchmarks.
For example, if a company reports $1,000,000 in revenue, with COGS at $600,000 and operating expenses at $300,000, the vertical analysis would represent COGS as 60% of total revenue and operating expenses as 30%. This percentage-based analysis helps stakeholders assess the efficiency of cost management and profitability in a structured format, enabling more informed financial decisions.
A vertical balance sheet analysis uses total assets as the base figure. Each item on the balance sheet—such as current assets, liabilities, and equity—is presented as a percentage of total assets, offering insights into the company’s financial structure and liquidity.
For instance, if current assets comprise 40% of total assets and long-term debt constitutes 30% of total liabilities and equity, this analysis reveals the company’s asset composition and financial leverage. Such a breakdown helps decision-makers assess liquidity, debt levels, and overall financial stability, guiding strategic decisions regarding capital structure and risk management.
Vertical analysis transforms raw financial data into meaningful percentages for interpretation. This is how one goes about conducting a vertical analysis:
The first step in vertical analysis is to select the appropriate financial statement based on the focus of your analysis. If you're evaluating profitability and expenses, choose the income statement. If you're looking at the company's financial structure and asset composition, opt for the balance sheet.
Once the financial statement is selected, determine the base figure. For the income statement, this is total revenue. For the balance sheet, the base figure is usually total assets. This base figure will serve as the denominator for calculating the percentage of each line item.
To compute the percentage for each line item, use the following formula:
Percentage = (Line Item Value/Base Figure) * 100%
For example, if total assets are $1,000,000 and inventory is $200,000, the calculation would be:
(200,000/1,000,000) * 100% = 20%
This means inventory represents 20% of the company’s total assets. This formula is applied consistently to all line items, providing a standardized view of each item’s significance relative to the base figure.
Once percentages are calculated, the next step is to interpret the results. Analyze the percentages to detect trends, assess cost efficiency, and identify areas of concern. For instance, if operating expenses represent a high percentage of revenue compared to prior periods or industry standards, it may signal inefficiencies. Similarly, low percentages in areas like net income or asset liquidity may indicate financial stress.
To get the most value from vertical analysis, comparing the results over different time periods (e.g., year-over-year) and against competitors or industry benchmarks is crucial. This helps identify trends, understand performance relative to peers, and recognize whether the company is improving or facing challenges in specific areas.
Vertical analysis helps understand the impact of the expenses on the net profit. Let's understand this with two examples:
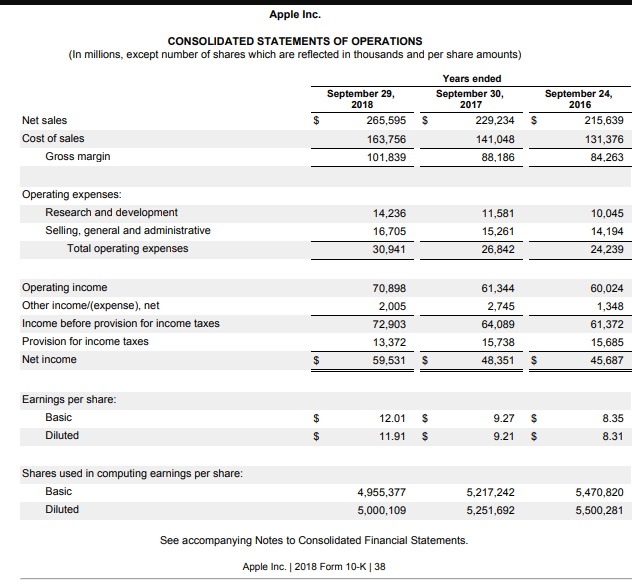
In Apple Inc.'s 2018 income statement, net sales are the base at 100%. Here’s how key line items are calculated as a percentage of total revenue:
Apple’s operating expenses increased slightly from 11.24% in 2016 to 11.65% in 2018. This might indicate a rise in operational costs, perhaps due to increased R&D or SG&A, reflecting strategic investments in innovation or higher administrative costs. Such shifts can point to operational improvement opportunities or highlight areas of investment needed for long-term growth.
Comparing percentages year-over-year, as seen in Apple's income statement, also highlights efficiency trends. For example, Apple’s gross margin in 2018 was 38.34%, slightly down from 39.08% in 2016. This slight decline suggests higher production costs or product mix changes but is not alarming due to their stable net income, which remained over 21%.
By identifying such changes in a vertical analysis, decision-makers can focus on cost control in SG&A or R&D or evaluate operational efficiency opportunities to improve the company’s profitability.
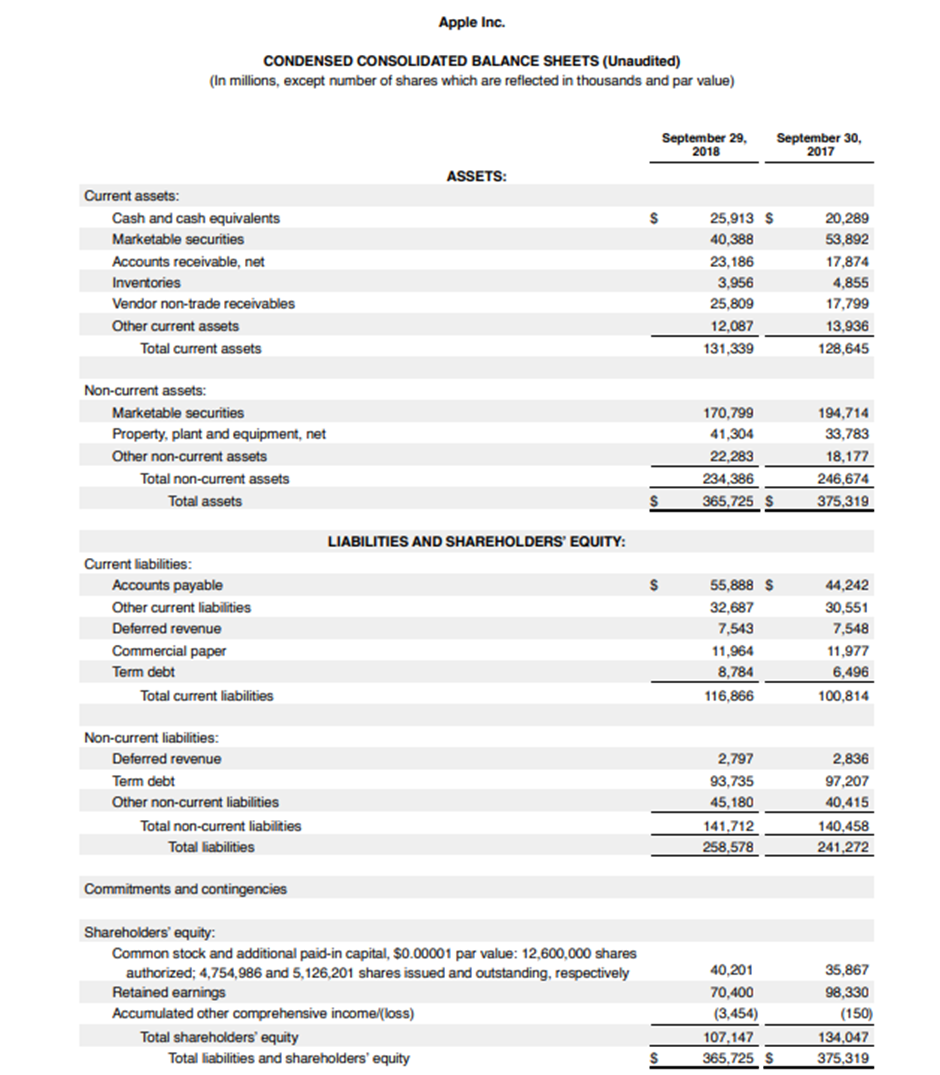
In Apple Inc.'s 2018 balance sheet, total assets ($365,725 million) are the base at 100%. Essential line items are calculated as follows:
Apple’s balance sheet shows a healthy capital structure with 64.1% in non-current assets, mainly marketable securities and property, plant, and equipment. However, its total liabilities (at 70.6% of total assets) indicate a reliance on both short and long-term liabilities, which might impact liquidity in the short term but provide leverage for growth investments.
The current liabilities of 31.9% vs. current assets of 35.9% suggest strong liquidity, as they have enough short-term assets to cover their immediate obligations. The shareholders' equity of 29.3% reflects a solid financial foundation, indicating that Apple has a significant equity base to support growth.
Vertical analysis is a powerful tool for financial strategy, offering insights by breaking down each item as a percentage of a baseline, such as total revenue or assets. Here are critical use cases:
Vertical analysis is a simple and effective way to understand financial data. It converts complex financial statements into easy-to-read percentages, offering key benefits:
While vertical analysis is a helpful tool for financial analysis, it has some limitations and drawbacks that should be considered:
Vertical analysis is a fundamental tool that transforms financial data into meaningful insights by converting figures into percentages. Throughout this blog, we explored how it helps evaluate resource allocation, benchmark against industry standards, and assess operational efficiency. By offering clear, standardized views of financial statements, vertical analysis aids finance leaders in making strategic decisions.
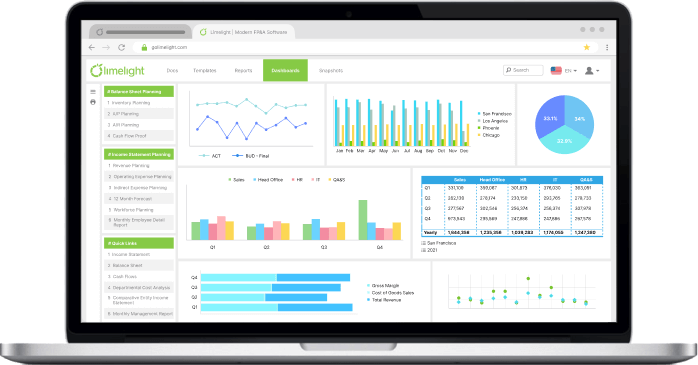
To take your vertical analysis to the next level, explore how Limelight’s advanced features can simplify your financial planning process and provide deeper insights into your data. Take the tour today!
Subscribe to our newsletter


.png?width=381&height=235&name=linkedinreal%20(27).png)